
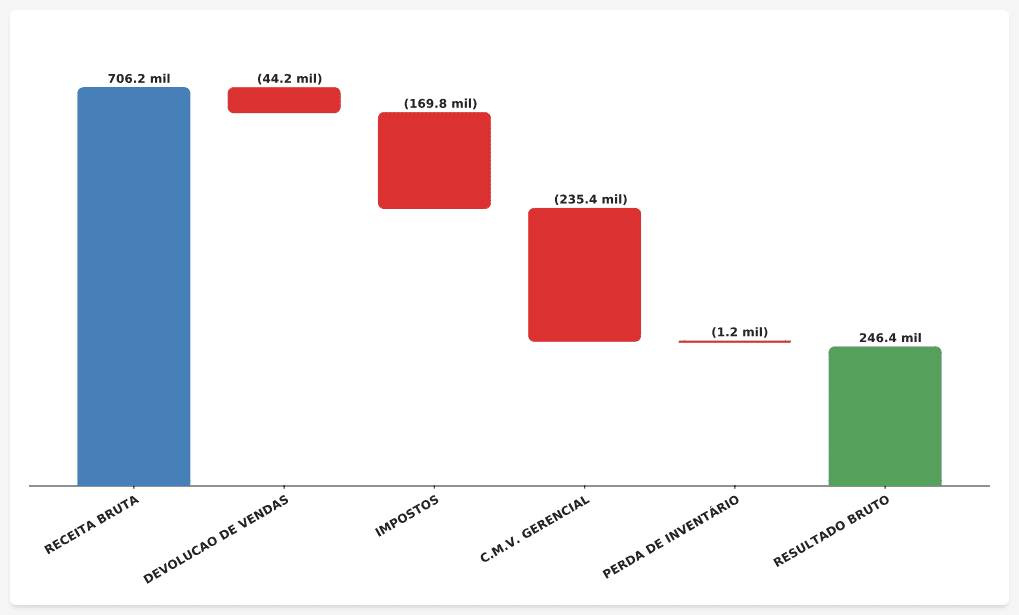
The waterfall chart is another alternative available for visualizing charts.
Waterfall charts are a visual tool used in many areas, such as business, finance, engineering and project management. These graphs are especially useful for representing the evolution of values over time, analyzing positive and negative contributions to a final result. They are called “waterfalls” because of their resemblance to the appearance of a waterfall, where the different elements flow sequentially.
Waterfall charts offer a clear and intuitive representation of how an initial value unfolds, revealing the intermediate steps that contribute to the final result. This makes it easier to identify trends, areas for improvement and critical points in a data series.
How to use it?

Click on your avatar at the top right and access BIMLabs. Within BIMLabs, enable the “Waterfall Graph” option.
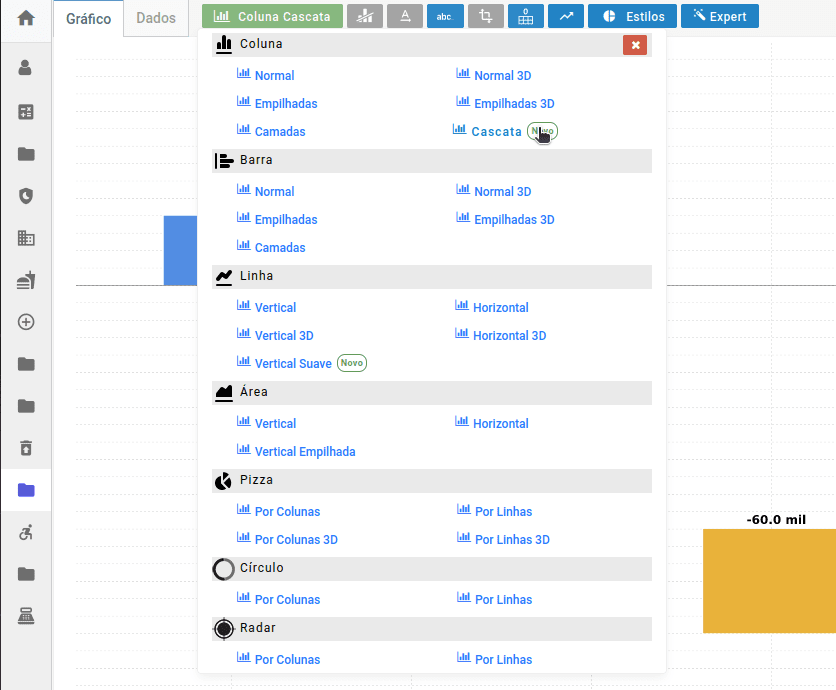
After enabling the graph option in BIMLabs, open an existing analysis or create a new one. Once the analysis is open, click on the green button that corresponds to the type of graph visualization in the top bar. Then select the “Waterfall” option.
Once you’ve done this, your waterfall graphic is ready. You can customize it however you like using the “Styles” tab in the top menu.