
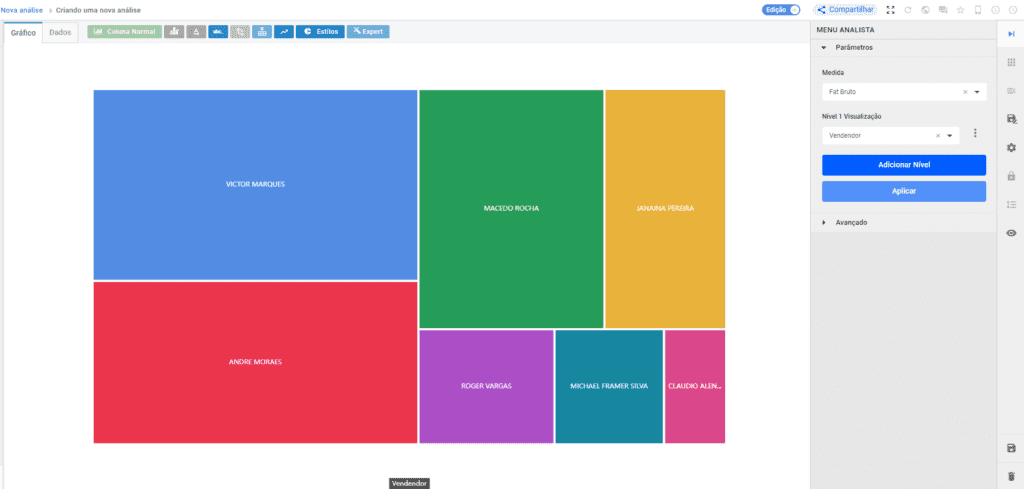
The treemap is a visual representation of hierarchical data, in which areas are used to show the proportion of each category in relation to the whole, allowing an effective visualization of the distribution and structure of the data. Examples of use are the representation of budget expenditure, resource allocation and categorization of hierarchical data in a single visualization.
Advantages Treemap
-
Clear hierarchical visualization: the tree map provides a hierarchical view that facilitates understanding of the structure and relationships between different categories and subcategories of data.
-
Effective pattern identification: The organized arrangement of rectangles in the treemap facilitates quick identification of patterns, outliers and areas of interest, enabling more efficient analysis.
-
Suitable for large data sets: The treemap is especially effective when dealing with large volumes of data, as it provides a compact and informative representation.
See more about creating a treemap: https://support.bimachine.com/how-to-create-a-treemap/