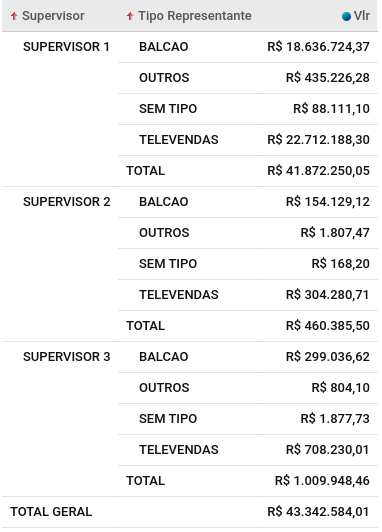
View the subtotal and the total sum of your data grouped and segmented.
This analysis allows the comparison of your group of data based on their related subgroups. You could check, for instance, the amount sold by teams and also segmented by salespeople.
Business example:
REVENUE by TEAM LEADER and SALES PERSON in the LAST YEAR
Parameters:
<Measures>:Metric to be analyzed
<Dimension1>: Parent dimension
<Dimension2>: Child dimension
<DinamicDateFilter>: Date filter chosen
Resulting table:


