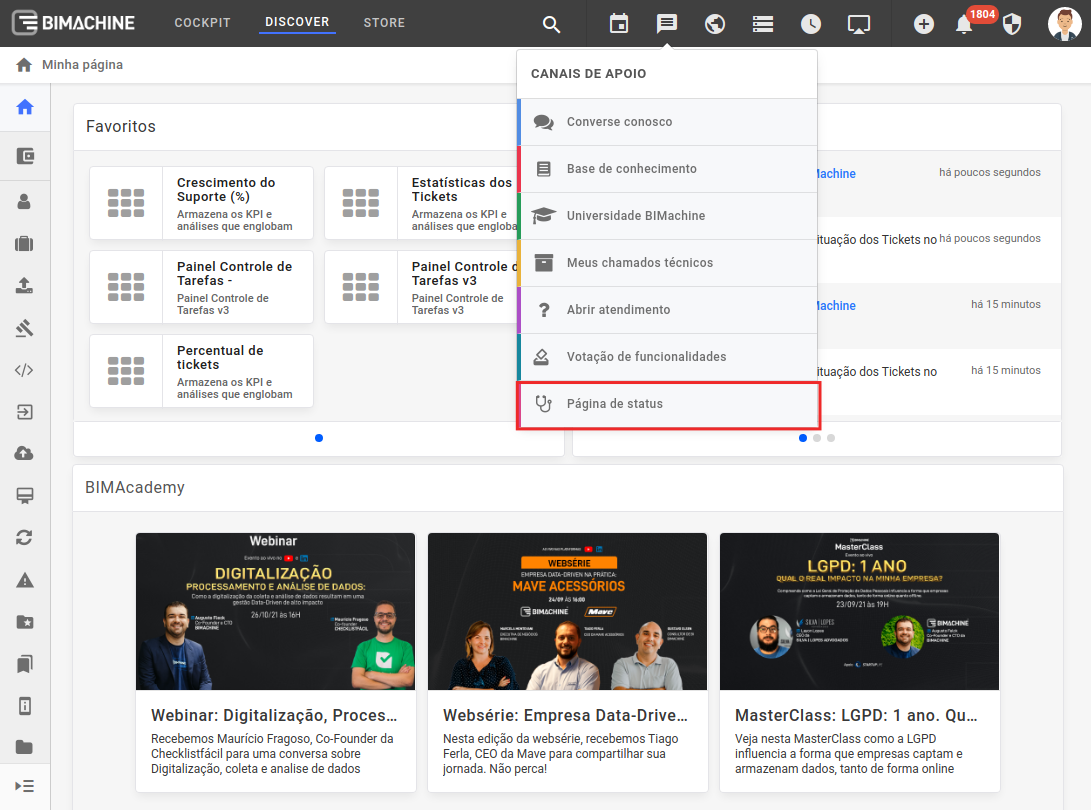
In order to facilitate the communication of important events and incidents that will happen on our platform, we have made available a status page that will record in chronological order all maintenance on our servers, as well as incidents and interruptions that may occur in certain resources.
This page is fed daily and the data contained there represent the official status of each of the services that make up our platform, the incidents reported on the page may be "Maintenance", "Performance degradation", "Partial interruption" and "Interruption total".
Access to the Status page can be done through the link: https://bimachine.statuspage.io or through the platform, accessing the Support Channels > Status Page.
Status
Whenever you access it and see the message "All Systems Operational", it means that there is no incident reported at the moment and that the tool is operating normally.
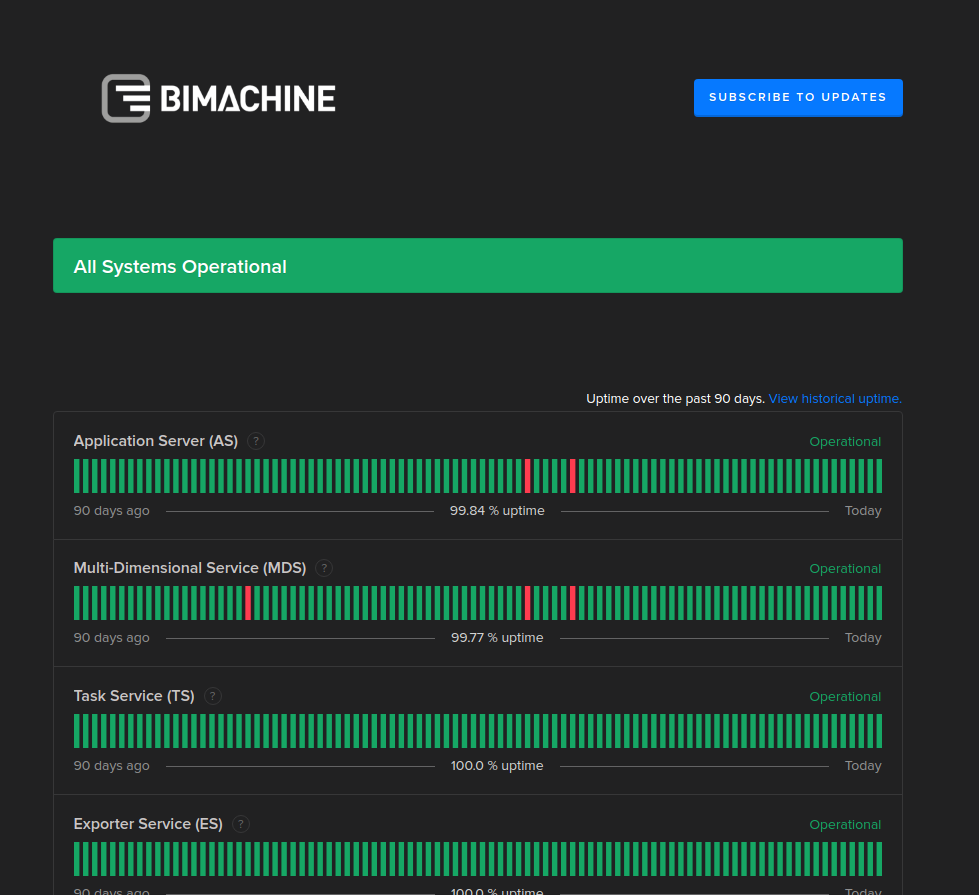
If there is any interruption, it will be recorded and represented chronologically through highlighted bars on each service, for example on November 19, where there was a partial instability in the visualization of objects, as shown in the print:
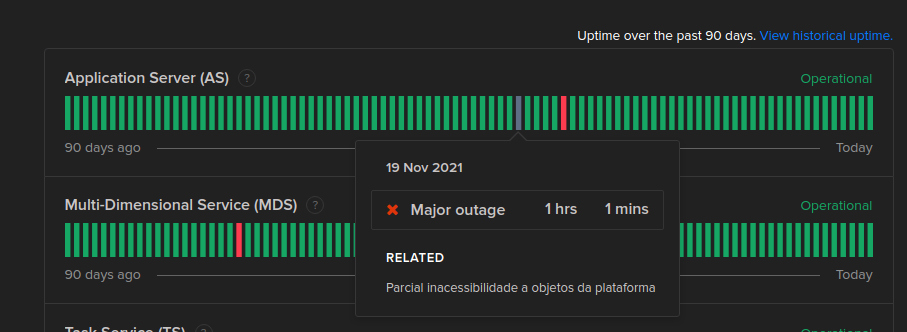
To learn more about the incident, just click on the reported title, or view the incident history on the page:

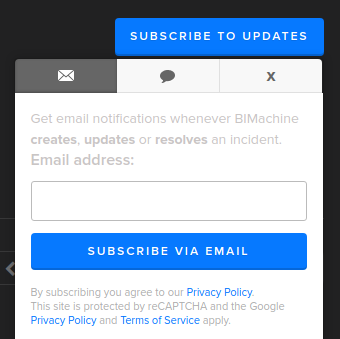
If you want to stay on top of all the incidents and maintenance reported on the page, just click on the "Subscribe to updates" button and enter your email address. Every time there is a new event an email will also be sent to you informing you of the changes, this notification is free of charge and can also be revoked if the information contained is no longer relevant.
Desempenho
Another very interesting feature on the status page is the average response time graph of requests made to our application server and also on the MDS server (responsible for rendering objects), this graph can be seen at day, week and month level.
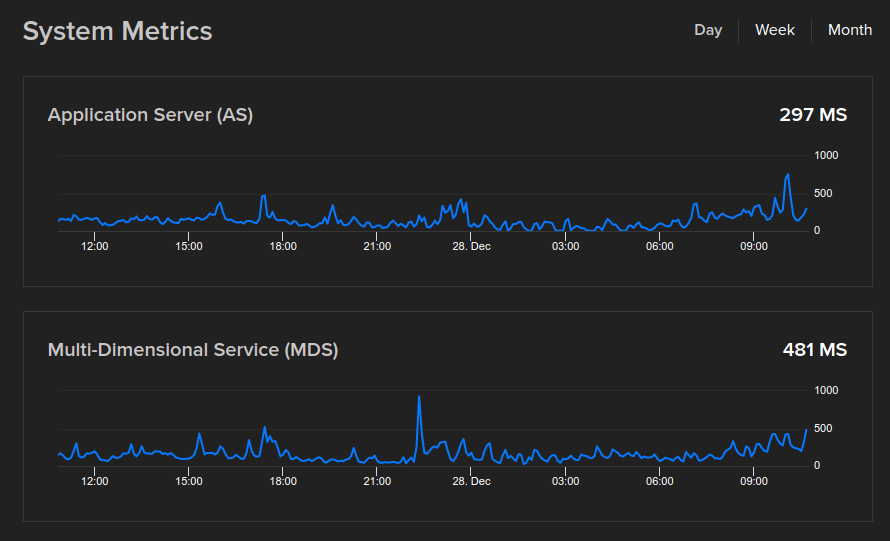
The times must be on average lower than 2000ms, which represents an average response of all requests less than 2 seconds.
Therefore, in case of slow platform use without an incident reported on our status page, the recommendation is to check the optimization level of the structures that are involved (Learn more), if the internet is operating normally, and if not it is a slowness related to a certain constructed object (sometimes it has a large volume of rows and columns, or an advanced formula).
Services
The components that are mapped in the monitoring are:
Application Server (AS) : The application is the module responsible for the user interface. Any user access to the tool is through the Application Server. It is through it that the user authenticates, accesses analyses, changes structures, schedules, etc.
Multi-Dimensional Service (MDS): The Multi-dimension Service is the module responsible for performing the DW queries. In short, it receives queries in MDX, and returns the information to the requester through analytical objects.
Task Service (TS): The Scheduler, also called Task Service (TS), is the module responsible for executing the services programmed by the user in the application, whether it is data loading, sending scheduling or generating books.
Exporter Service (ES): The Exporter, also called Exporter Service (ES), is the module responsible for generating PDF of analytical objects.
Presentation Service (PS): The Presenter, or Presentation Service (PS), is the module responsible for generating and making dynamic presentations available to users.
Help Desk Service (HDS): Help Desk Service (HDS) is BIMachine’s user service, where all technical calls will be registered to resolve issues with operating problems, doubts about the platform, suggest new features or request specialized services.
BIM News Service (News): BIM News is our BIMachine news portal, through it we will disclose new features, webinars, training available to customers and partners, events and news in general.
Integration Service (IS): É o serviço de integração da BIMachine com outras plataformas de maneira nativa para realizarmos a criação de estruturas de dados e inteligência sobre as informações recebidas via API.
BIM Store Service: BIMStore é nossa Loja de aplicações analíticas, as Apps Analíticas são soluções acessíveis e ágeis para implantação de projetos BI.
Temos também algumas integrações automatizadas com serviços de nossos parceiros, são eles:
Google Cloud Platform Google Cloud DNS: O Google Cloud DNS é um serviço de Sistema de Nome de Domínio (DNS), incidentes envolvendo este serviço poderão trazer instabilidade na comunicação entre BIMachiners e clientes.
AWS Servers: Os nossos servidores estão hospedados na AWS e um problema ou oscilação na prestação deste serviço poderá trazer impacto ao restante dos componentes.
AWS Lightsail Server: Uma pequena parcela de serviços (não fundamentais) está presente em máquinas lightsail na AWS, havendo qualquer incidente iremos também reportar em qual serviço haverá impactos.
AWS Simple Notification Service: É o sistema de notificação da AWS, utilizado para fazer por exemplo a chamada no disparo de envio de emails da ferramenta.
AWS Simple Email Service: Serviço responsável pelo disparo de emails.
GitHub API Requests: Possuímos integração direta entre BIMachine e Github, havendo algum incidente sobre a resposta de API, possivelmente haverá alguma instabilidade no processo de carga deste conector.
RCA
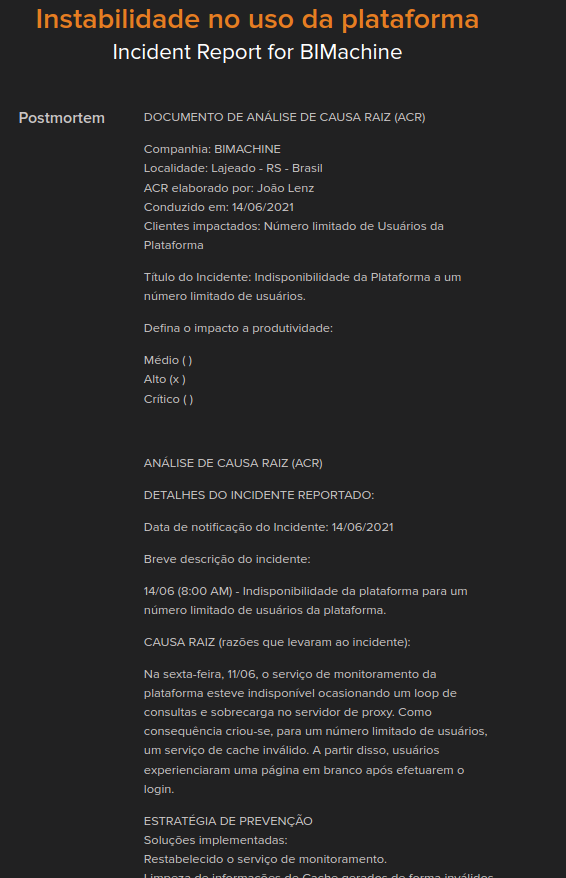
In case of serious incidents that make it impossible to use the tool for a certain period of time or that negatively affect a large number of users, we build a document called Root cause analysis (RCA).
This document will be available on the Status page itself and aims to detail the incidents recorded, as well as devise prevention strategies to prevent the same problem from happening again.
Example part of an ACR:
