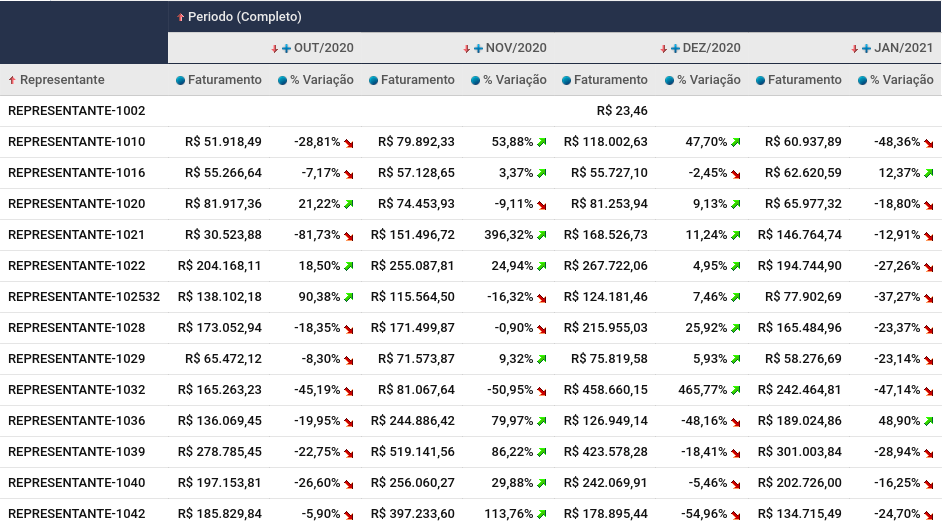
The variation table allows you to visualize the variation of the values of a metric over time in an analysis dimension. See, for example, from each of your salespeople how much your monthly revenue has changed.

See the variation of a metric over a period of time in tabular form.

