View the evolution of the moving average in a timeline.
This analysis allows the comparison of a metric with its moving average over time. See, for example, how your sales are evolving compared to the moving average of the last 6 months.
Application example:
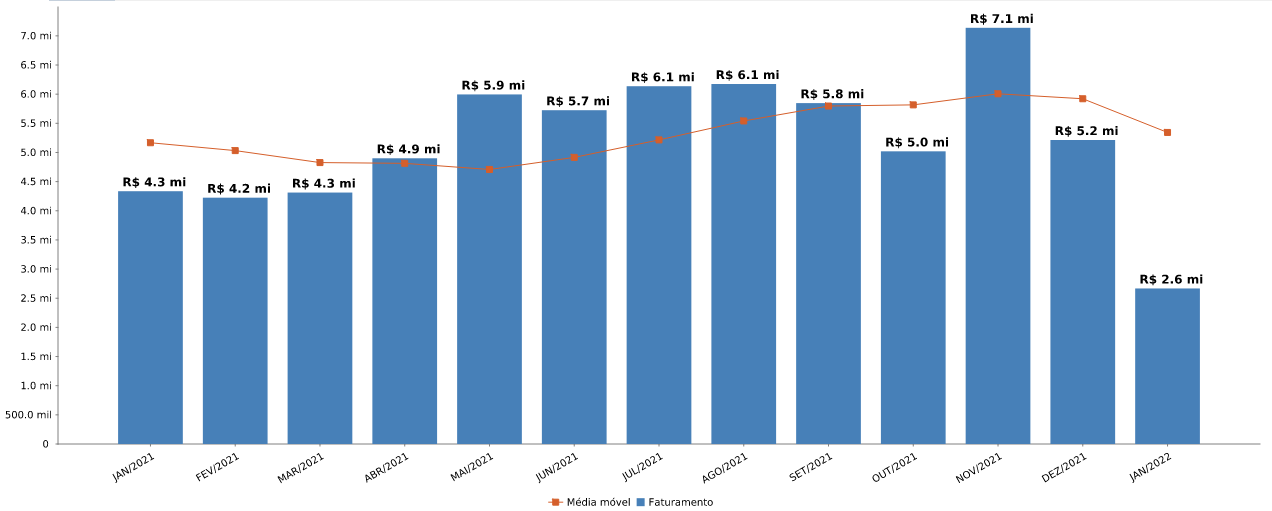
Evolution of the LAST 12 MONTHS of REVENUES compared to the moving average of 6 MONTHS, on the ISSUE PERIOD dimension.
Resulting chart:


