Importing your data
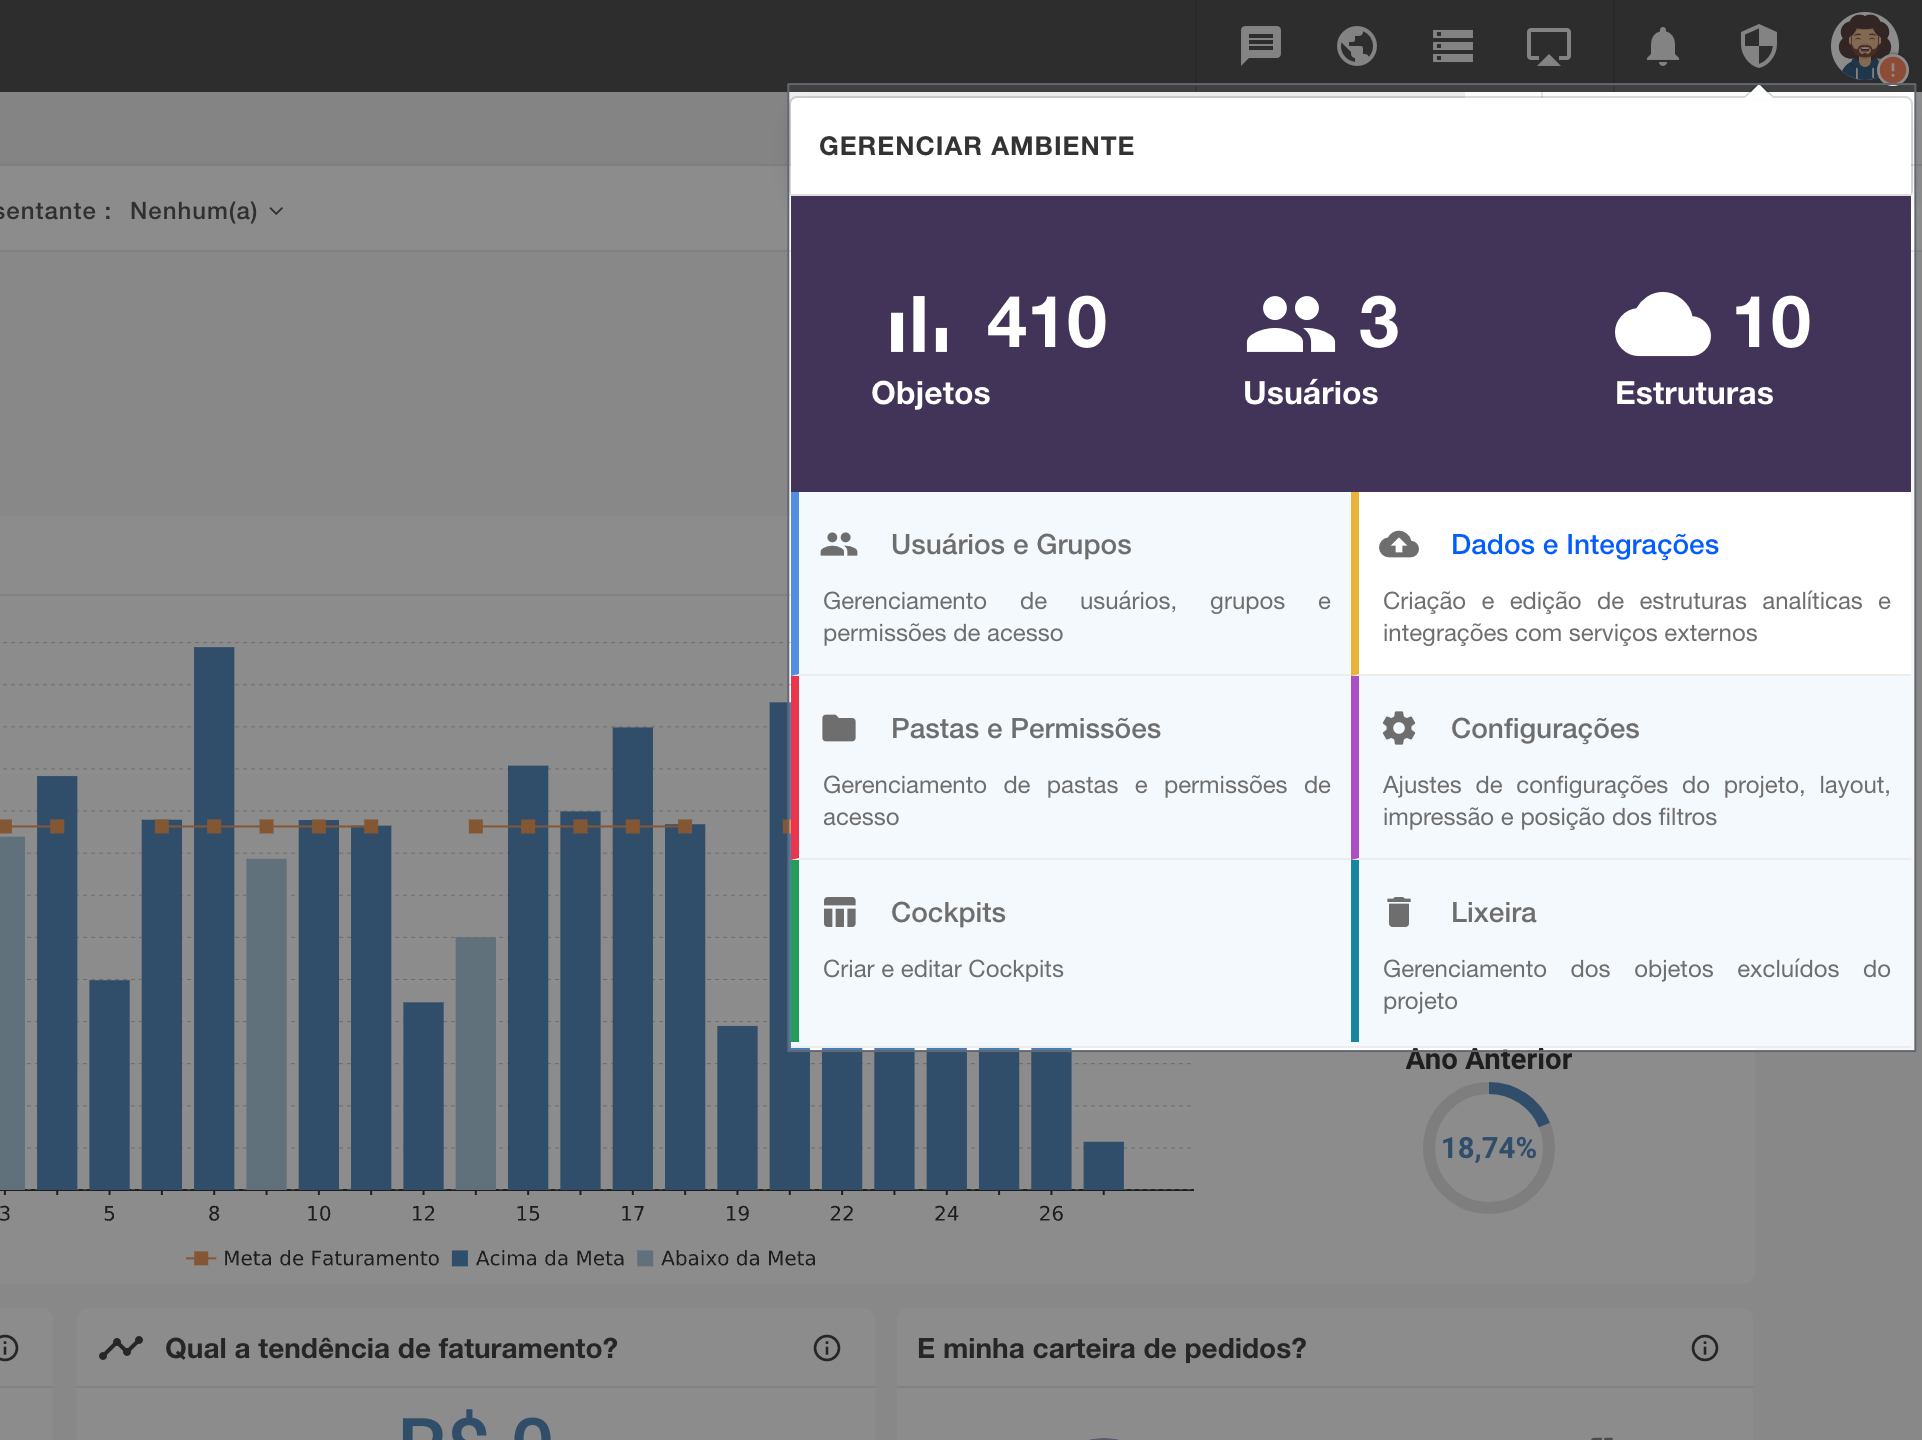
With the developer user you can import your own data via our connectors and integrations. To do this, click on the “Manage Environment” icon and go to “Data and Integration”.
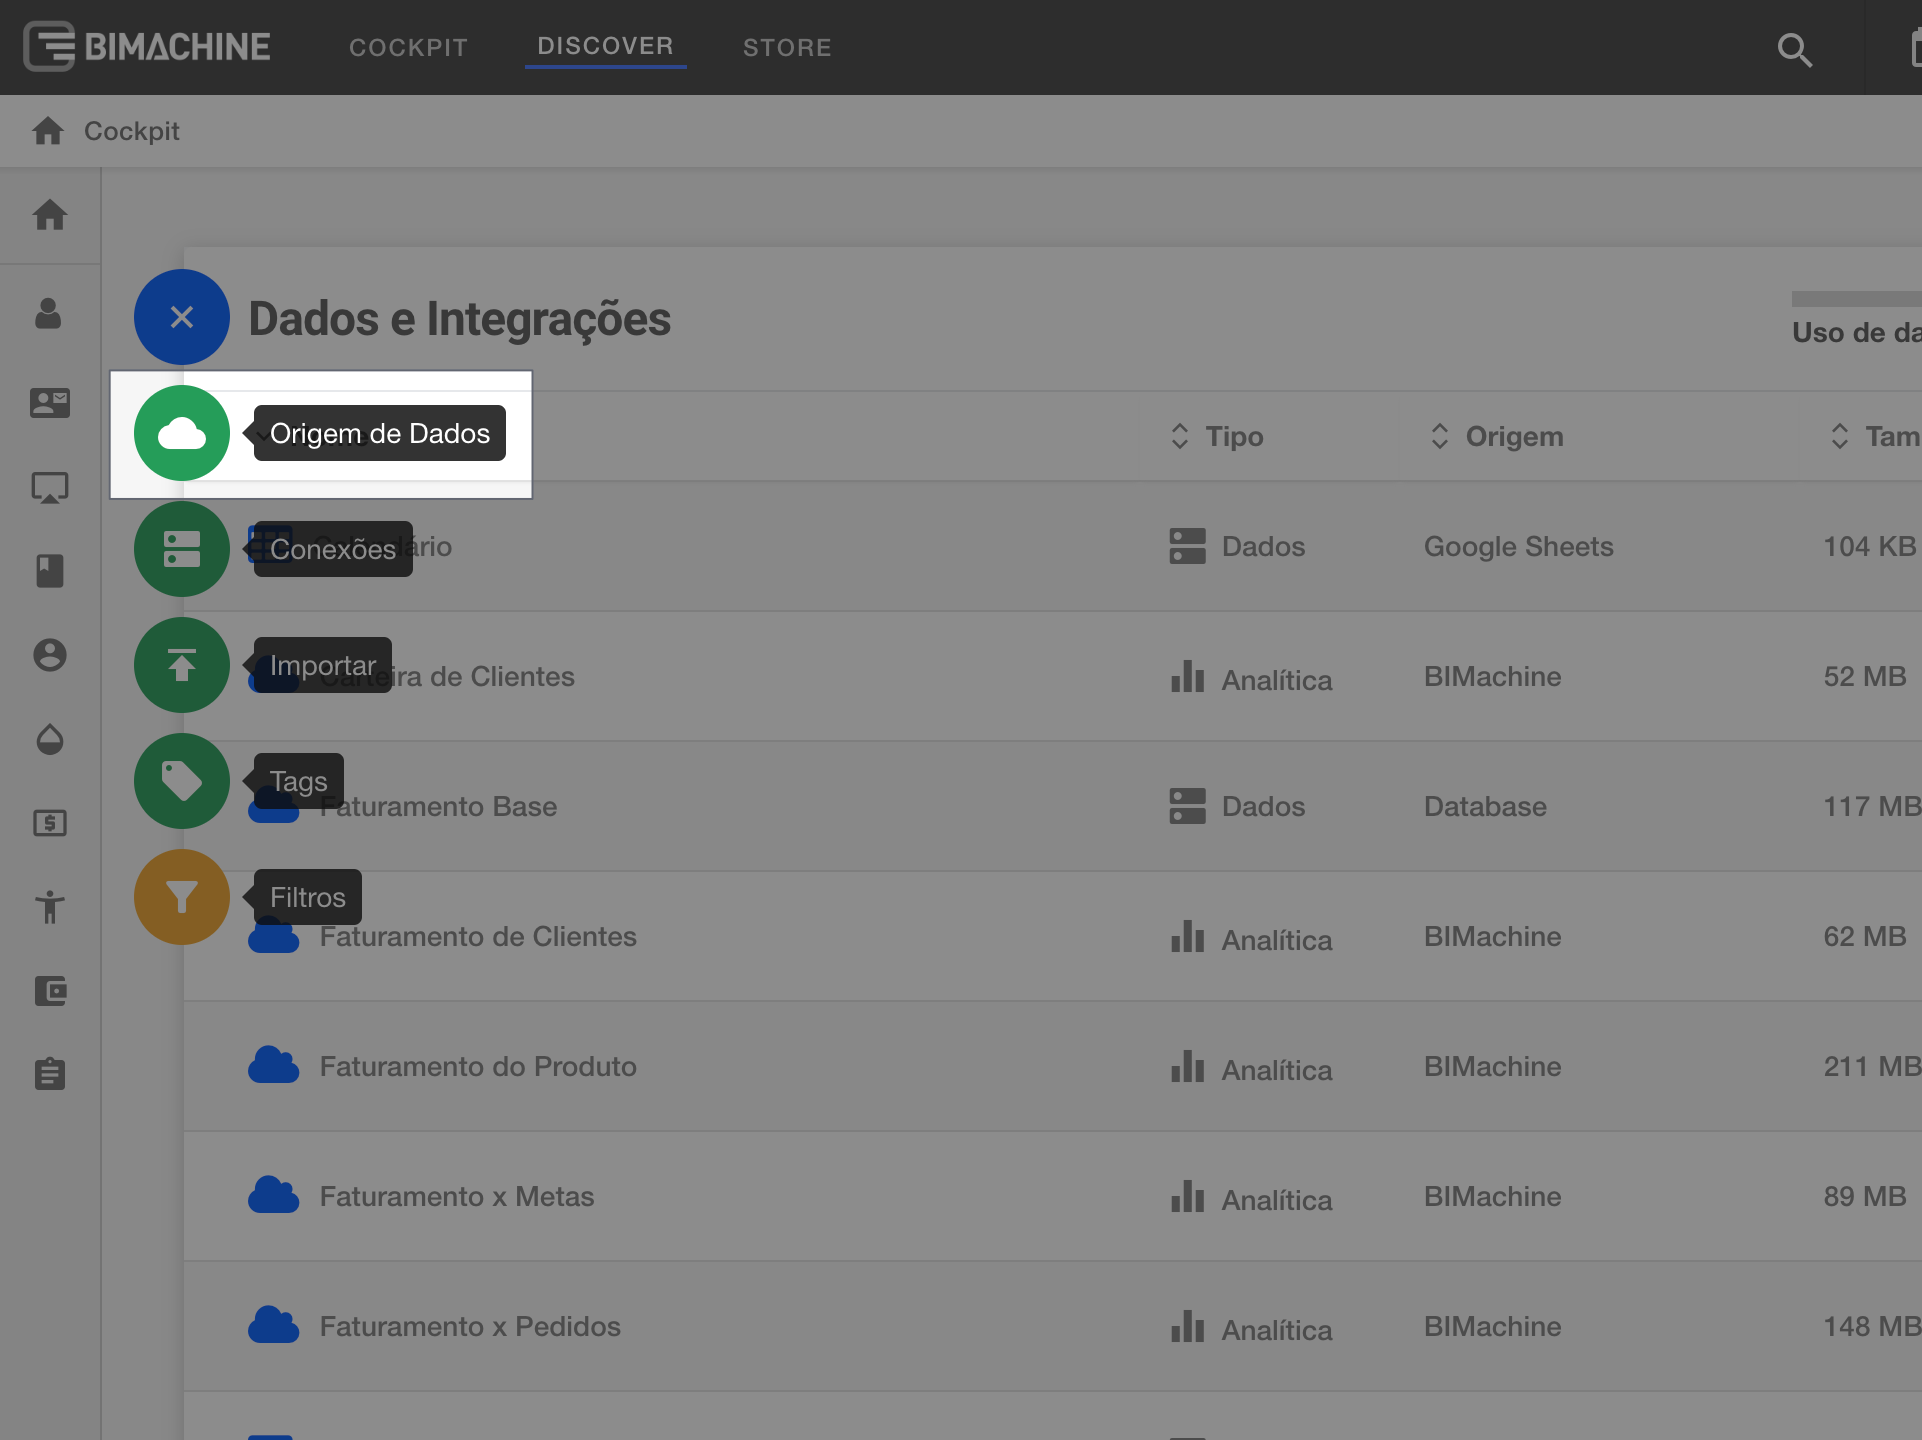
Under Data and Integrations you will find all the data structures created in your environment. To create new structures, look for the “+” icon. To create a new data source, go to “Data Sources”.
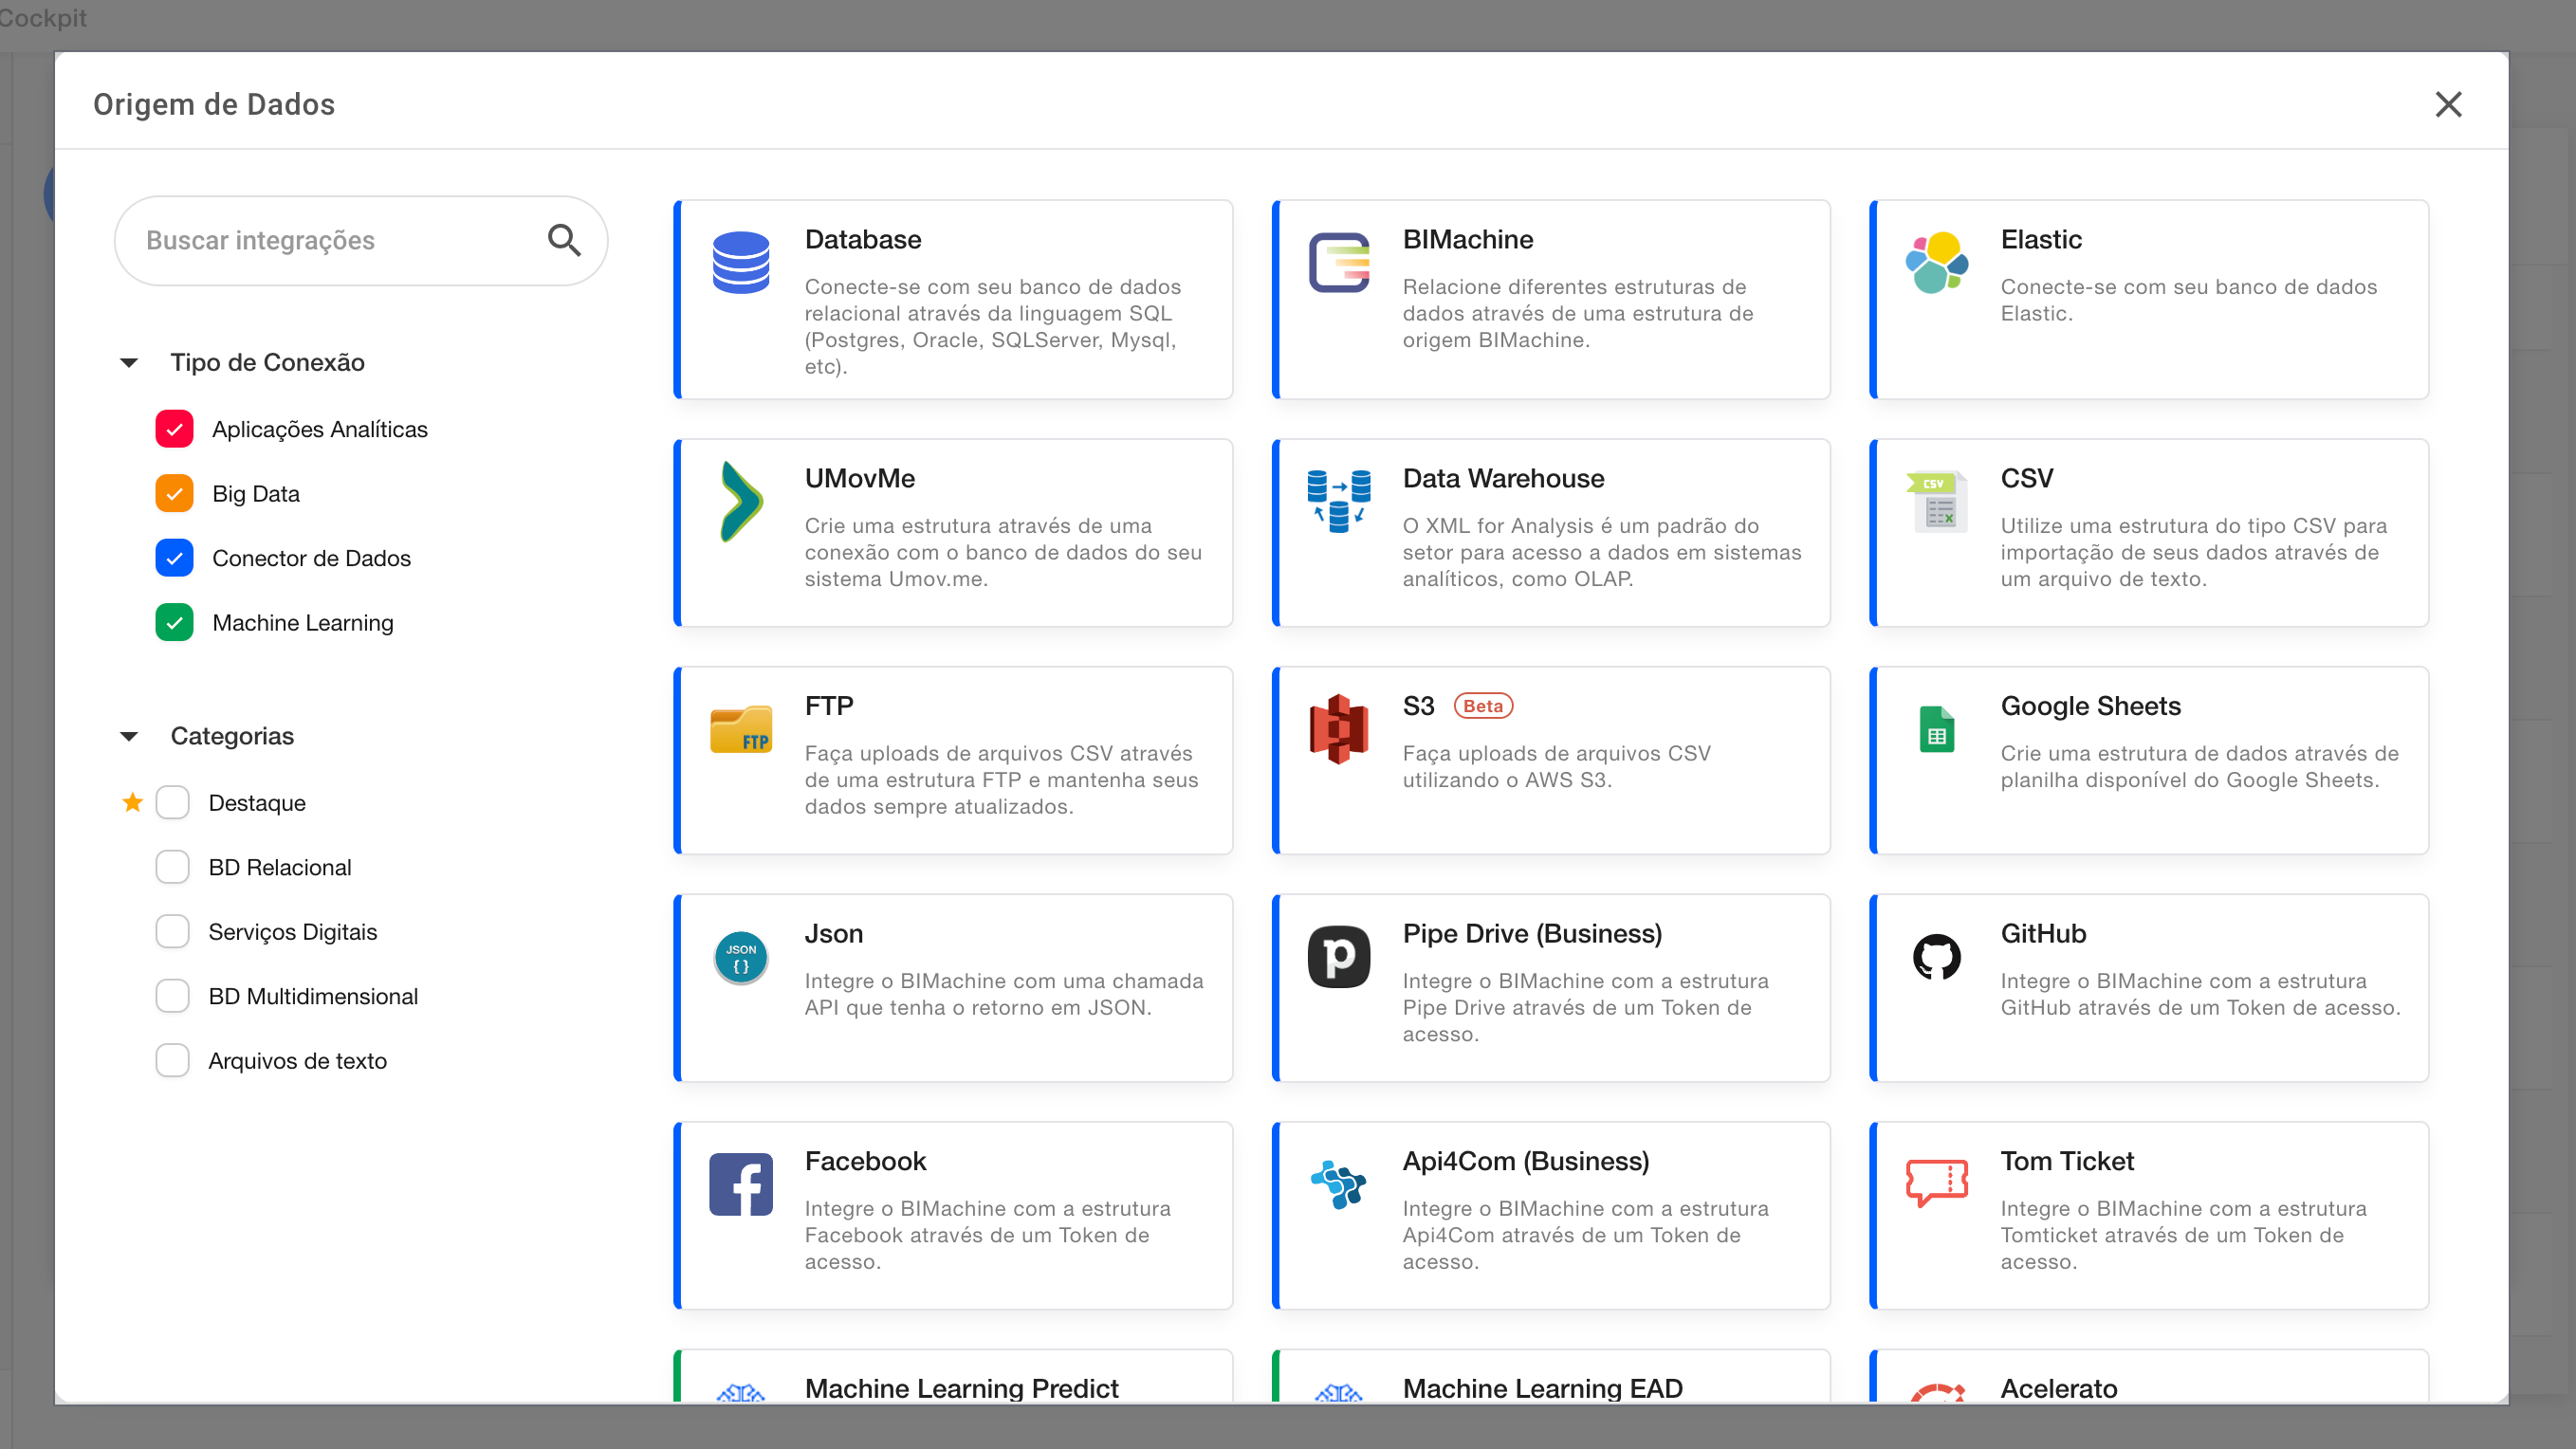
The structure creation screen will open, where you can create various integrations with our native integrators, text files such as CSV, Google Sheets and database connections.
Check out the step-by-step video:
Creating your first analyses
The developer user has access to all our creation tools, making it possible to create analyses, indicators (KPIs), maps, dashboards and much more. To access the creation menu, with Discover mode active look for the “Creating analytical objects” icon.
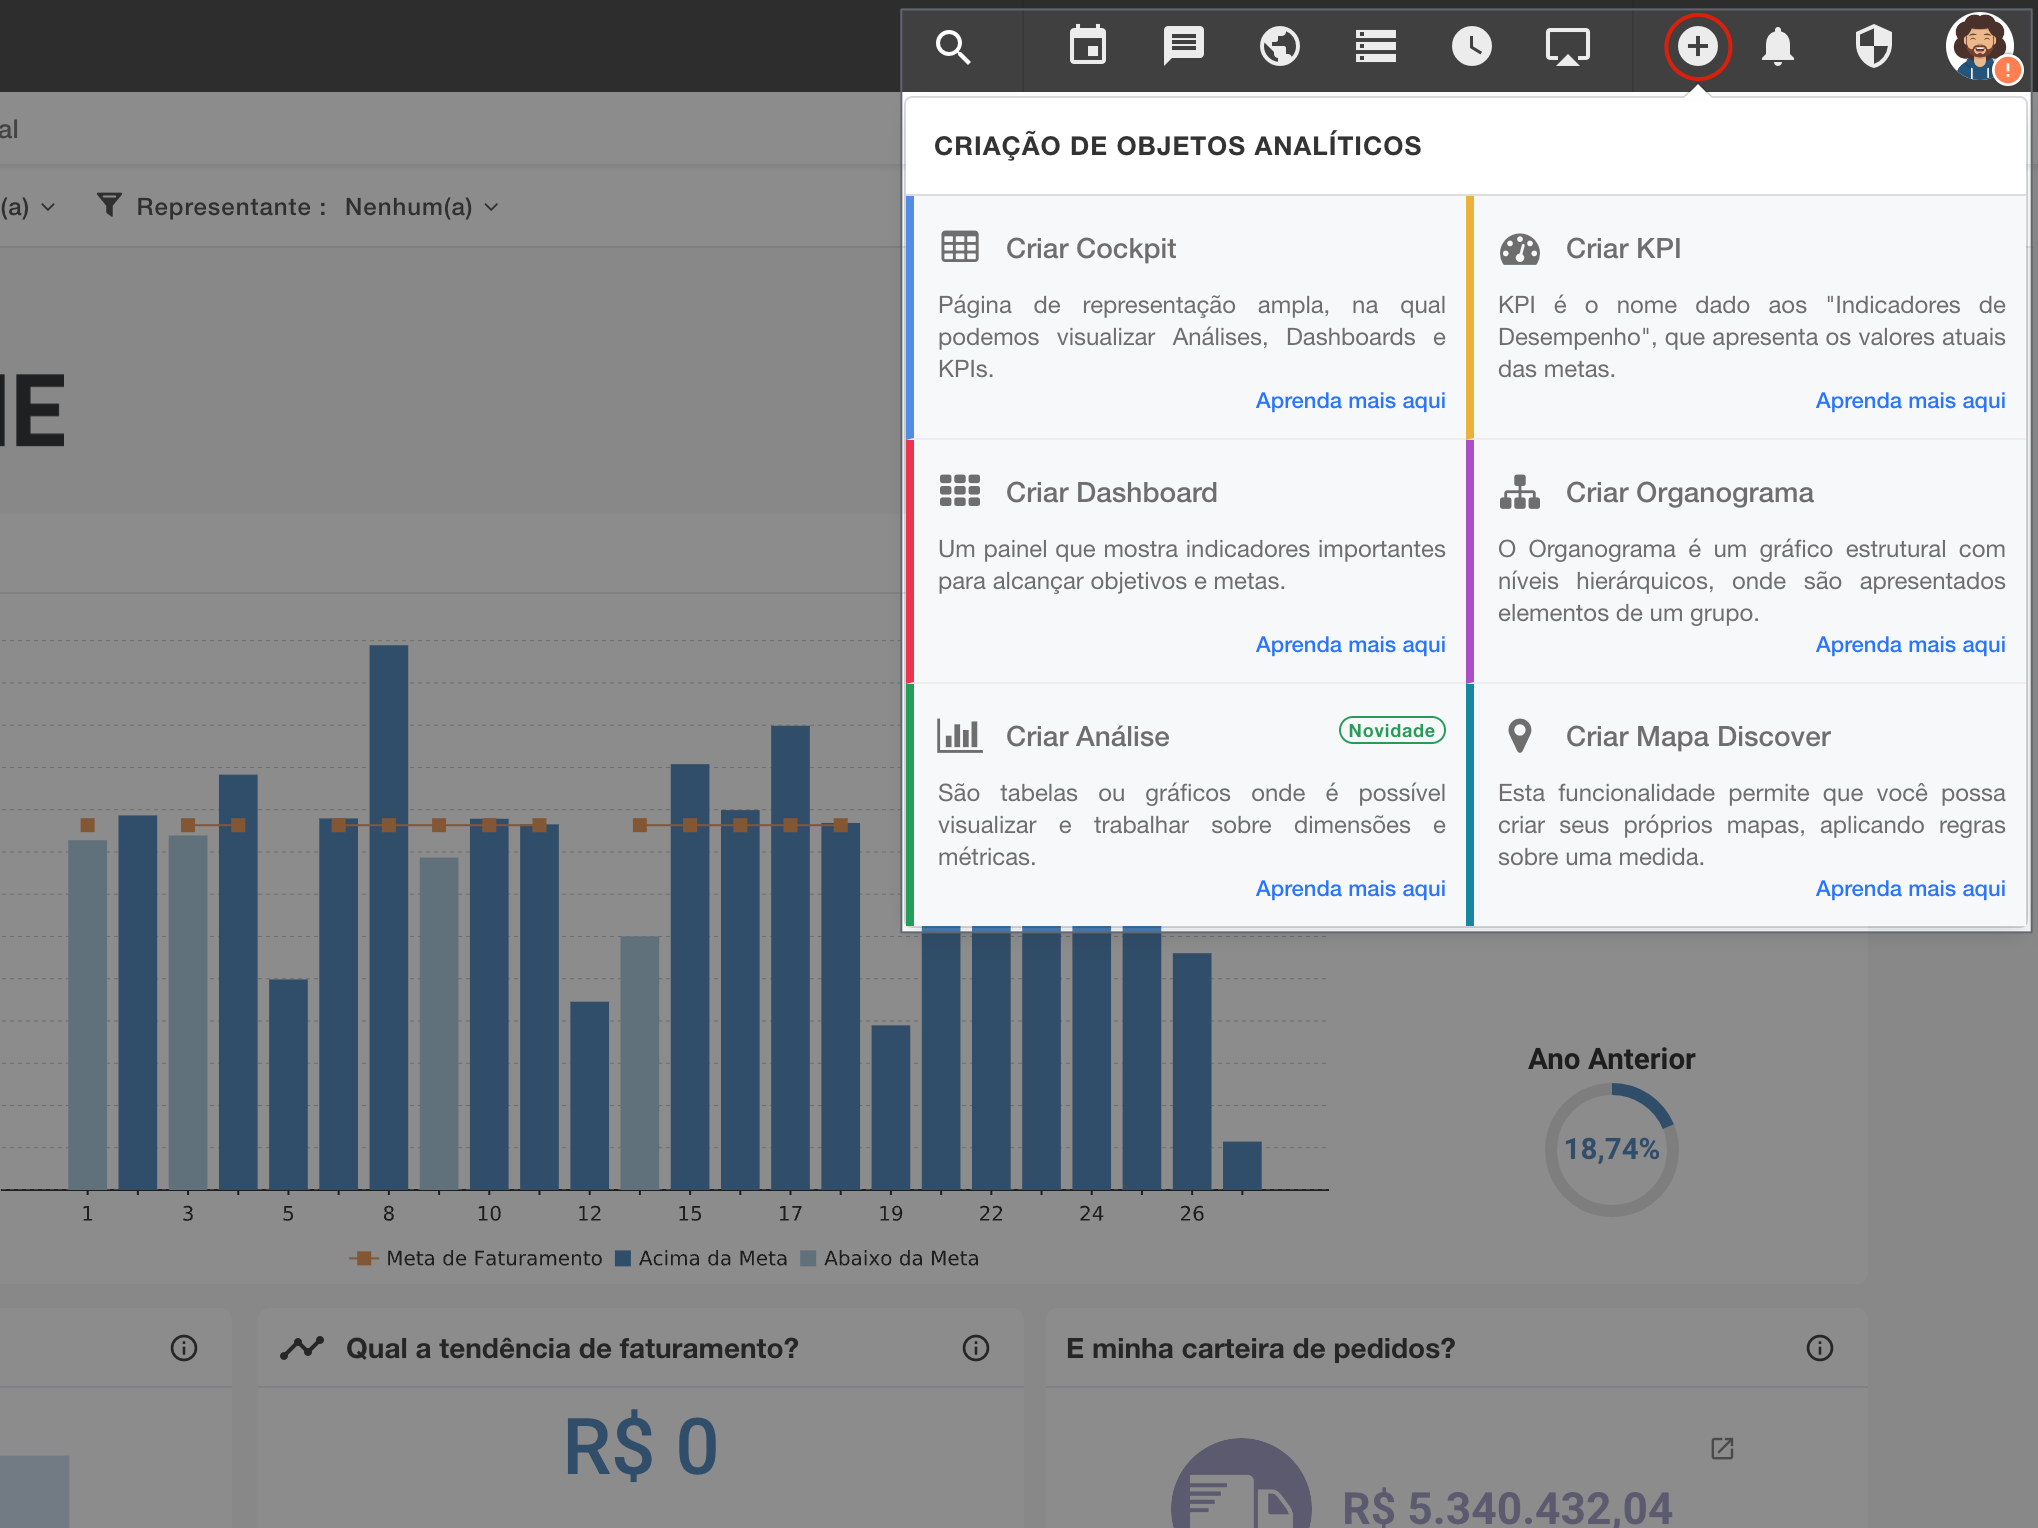
To create analyses, go to “Create analysis”.
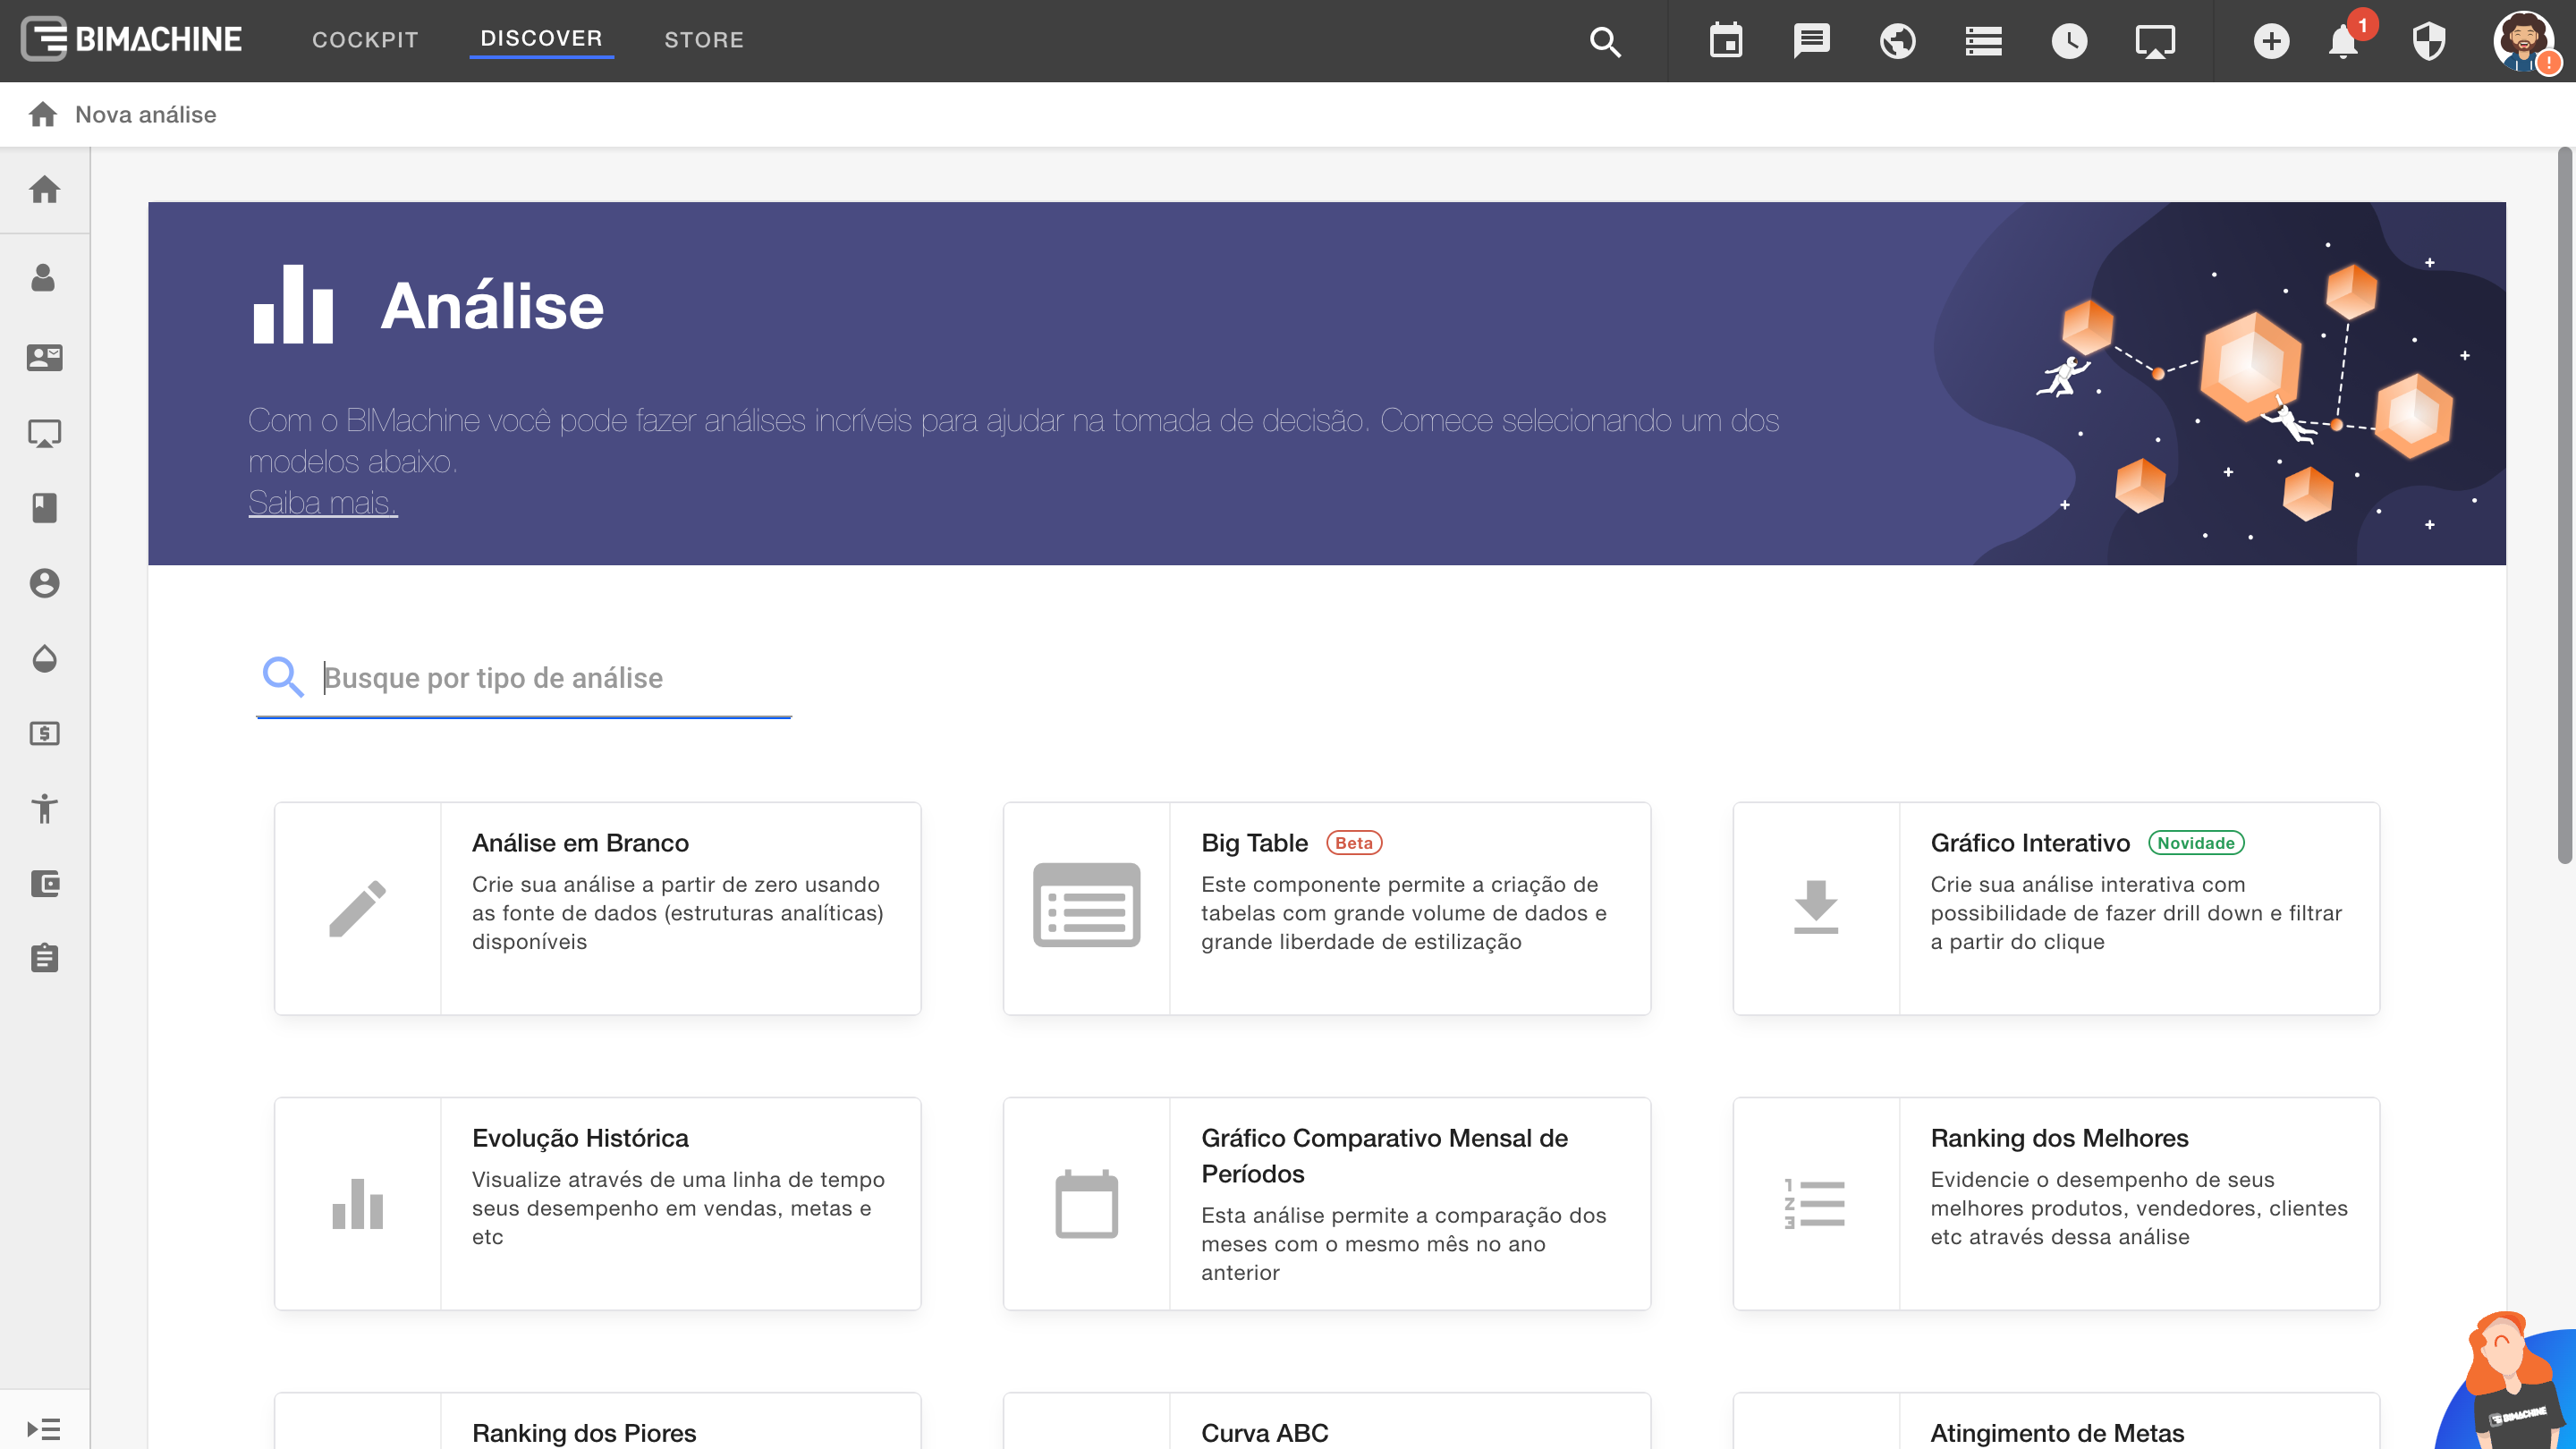
The analysis creation menu will open, and you can enjoy all the pre-configured analyses we have, called “Assisted analyses”, which can be configured in just a few clicks. If you prefer, you can also create a blank analysis. Remember: it’s your environment, so you can take advantage of all the possibilities and scenarios.
Check out the step-by-step video:
Creating dashboards
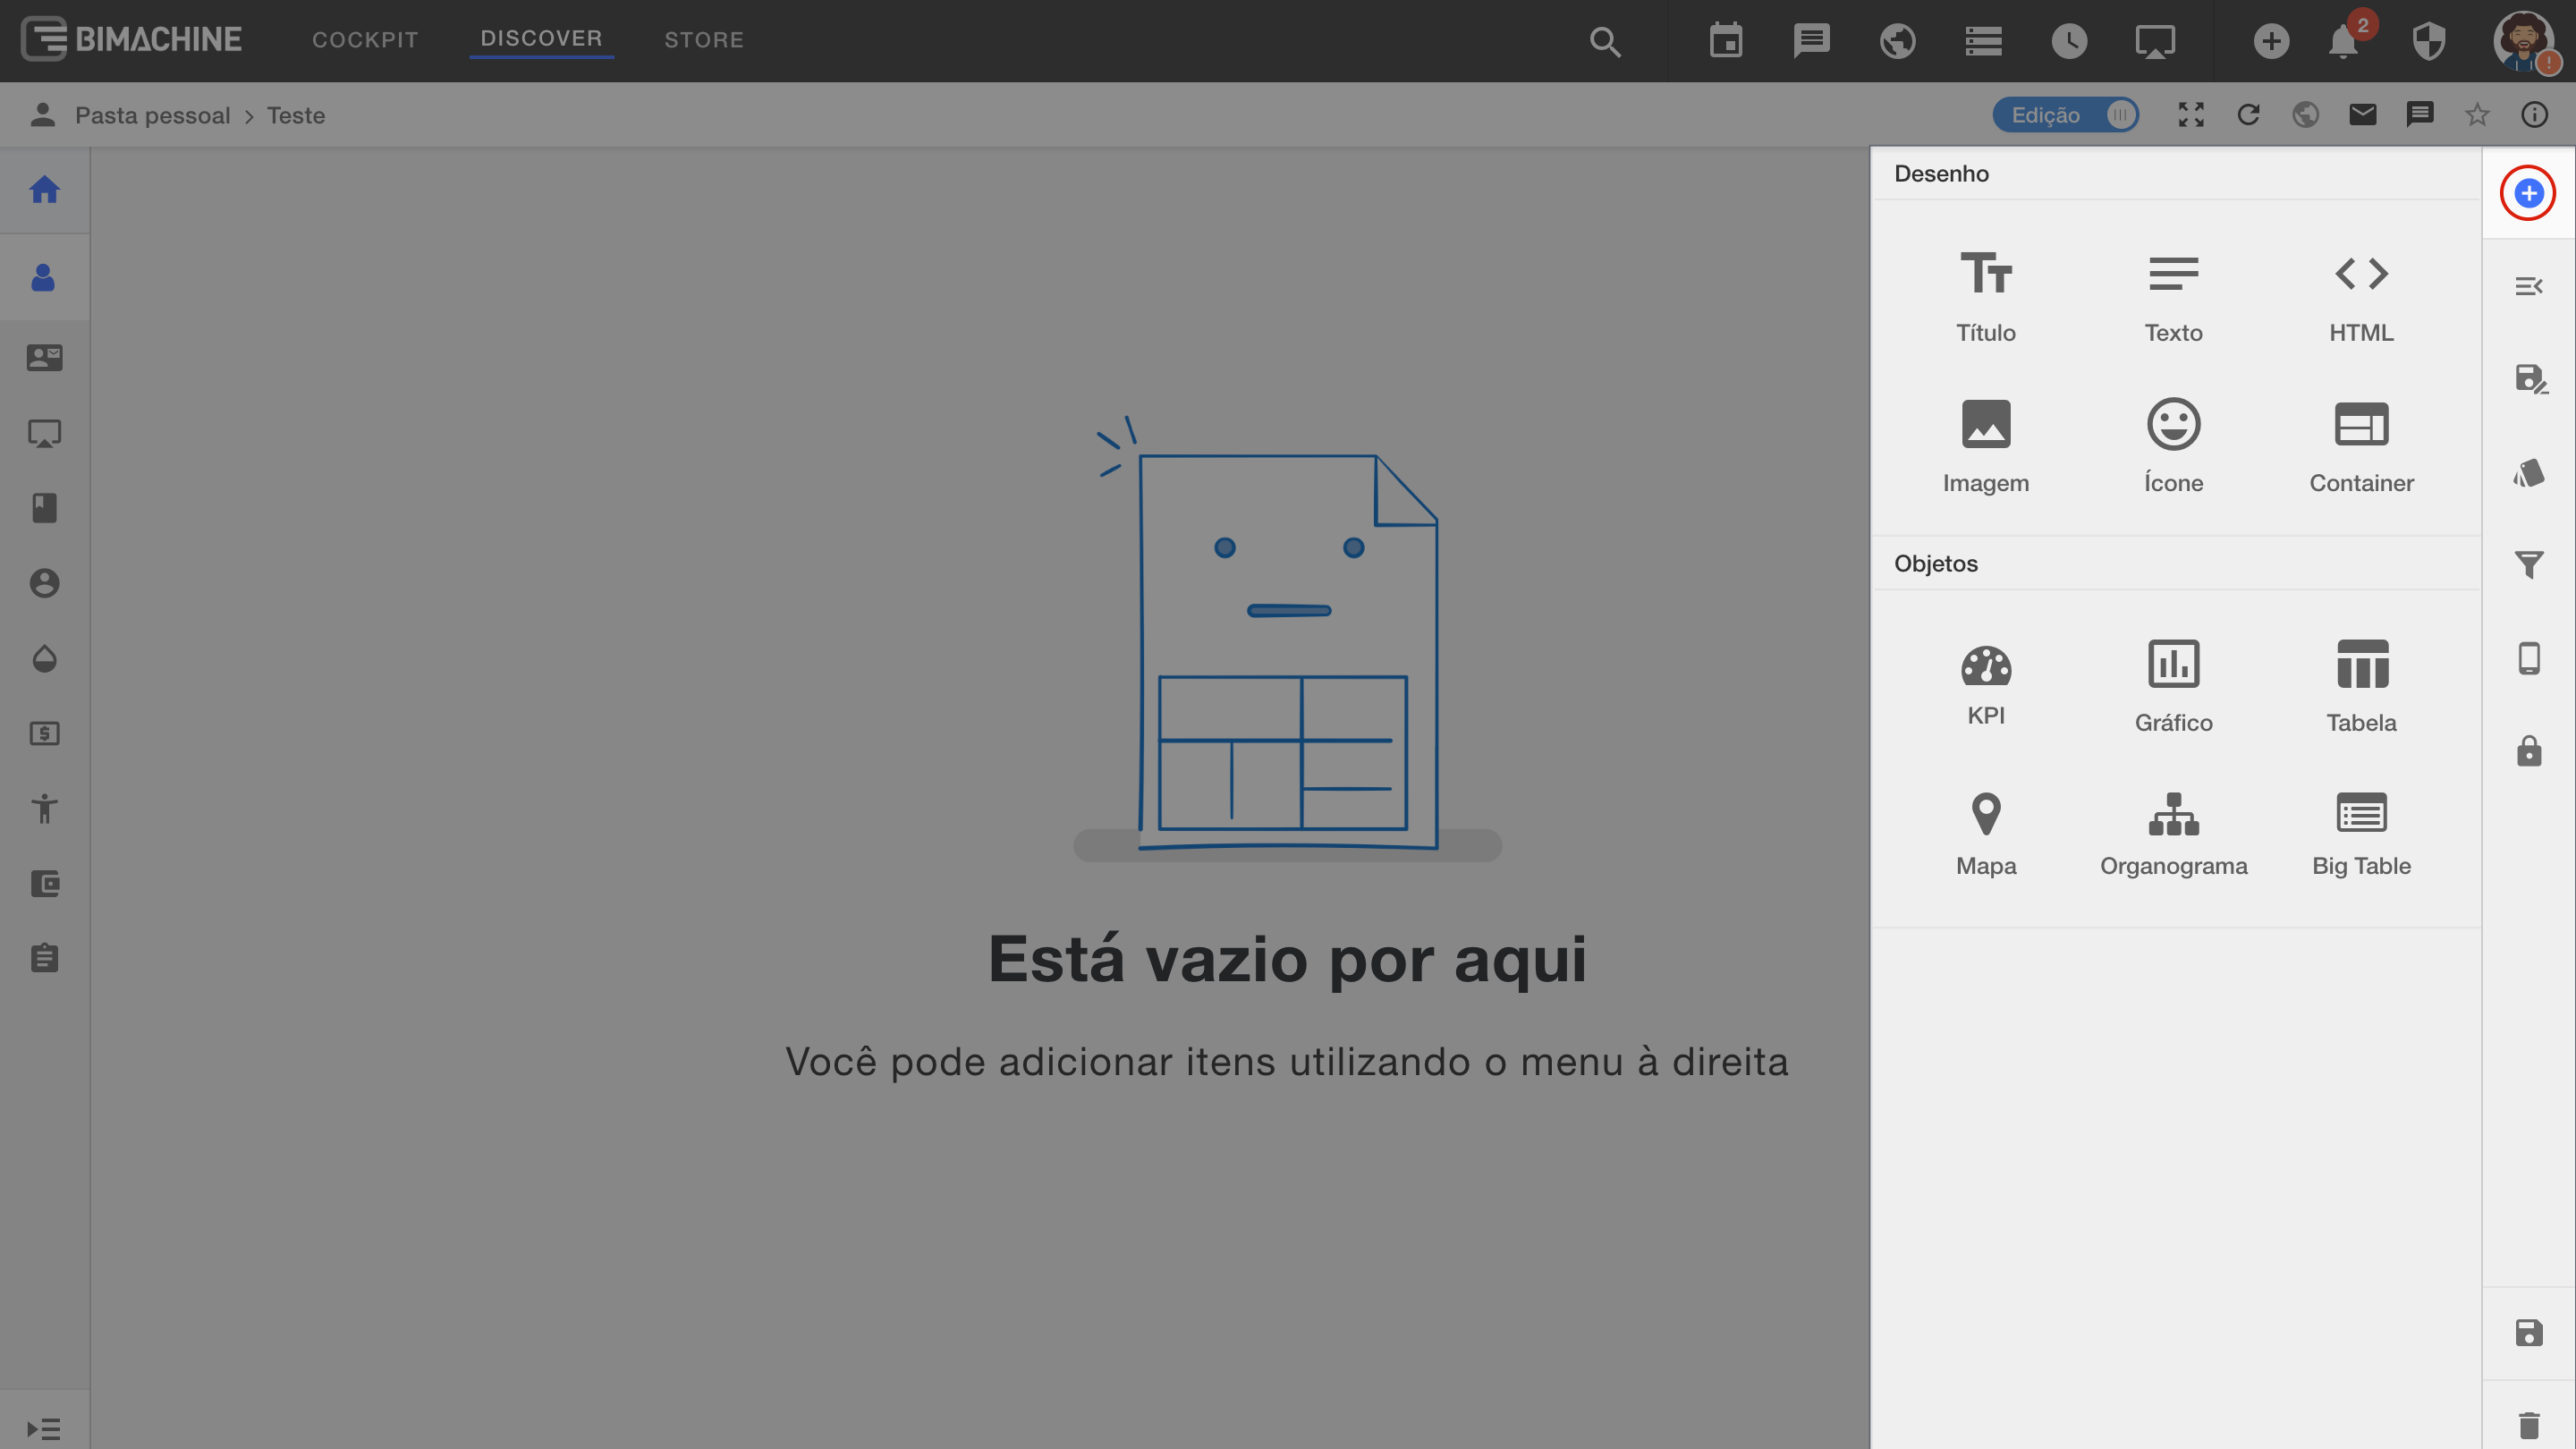
The dashboard is an analytical object that brings together all the previously created objects into a single object, making it easier and more intuitive to view the main analyses and indicators. To create a new dashboard, go to the “Creating analytical objects” menu and click on “Create dashboard”.

After selecting the name and save location, a new dashboard is created. In the right-hand side menu you’ll find the “Add element” button, where you can add all the objects you created previously, as well as graphic elements such as icons, images and custom code.
Check out the step-by-step video:
Inviting new users to your project
You can easily invite users to be part of your analytical environment and have the possibility of sharing your analyses, indicators, dashboards and periodically scheduling information for these users. To do this, go to the “Users and Groups” screen in the “Manage Environment” icon.
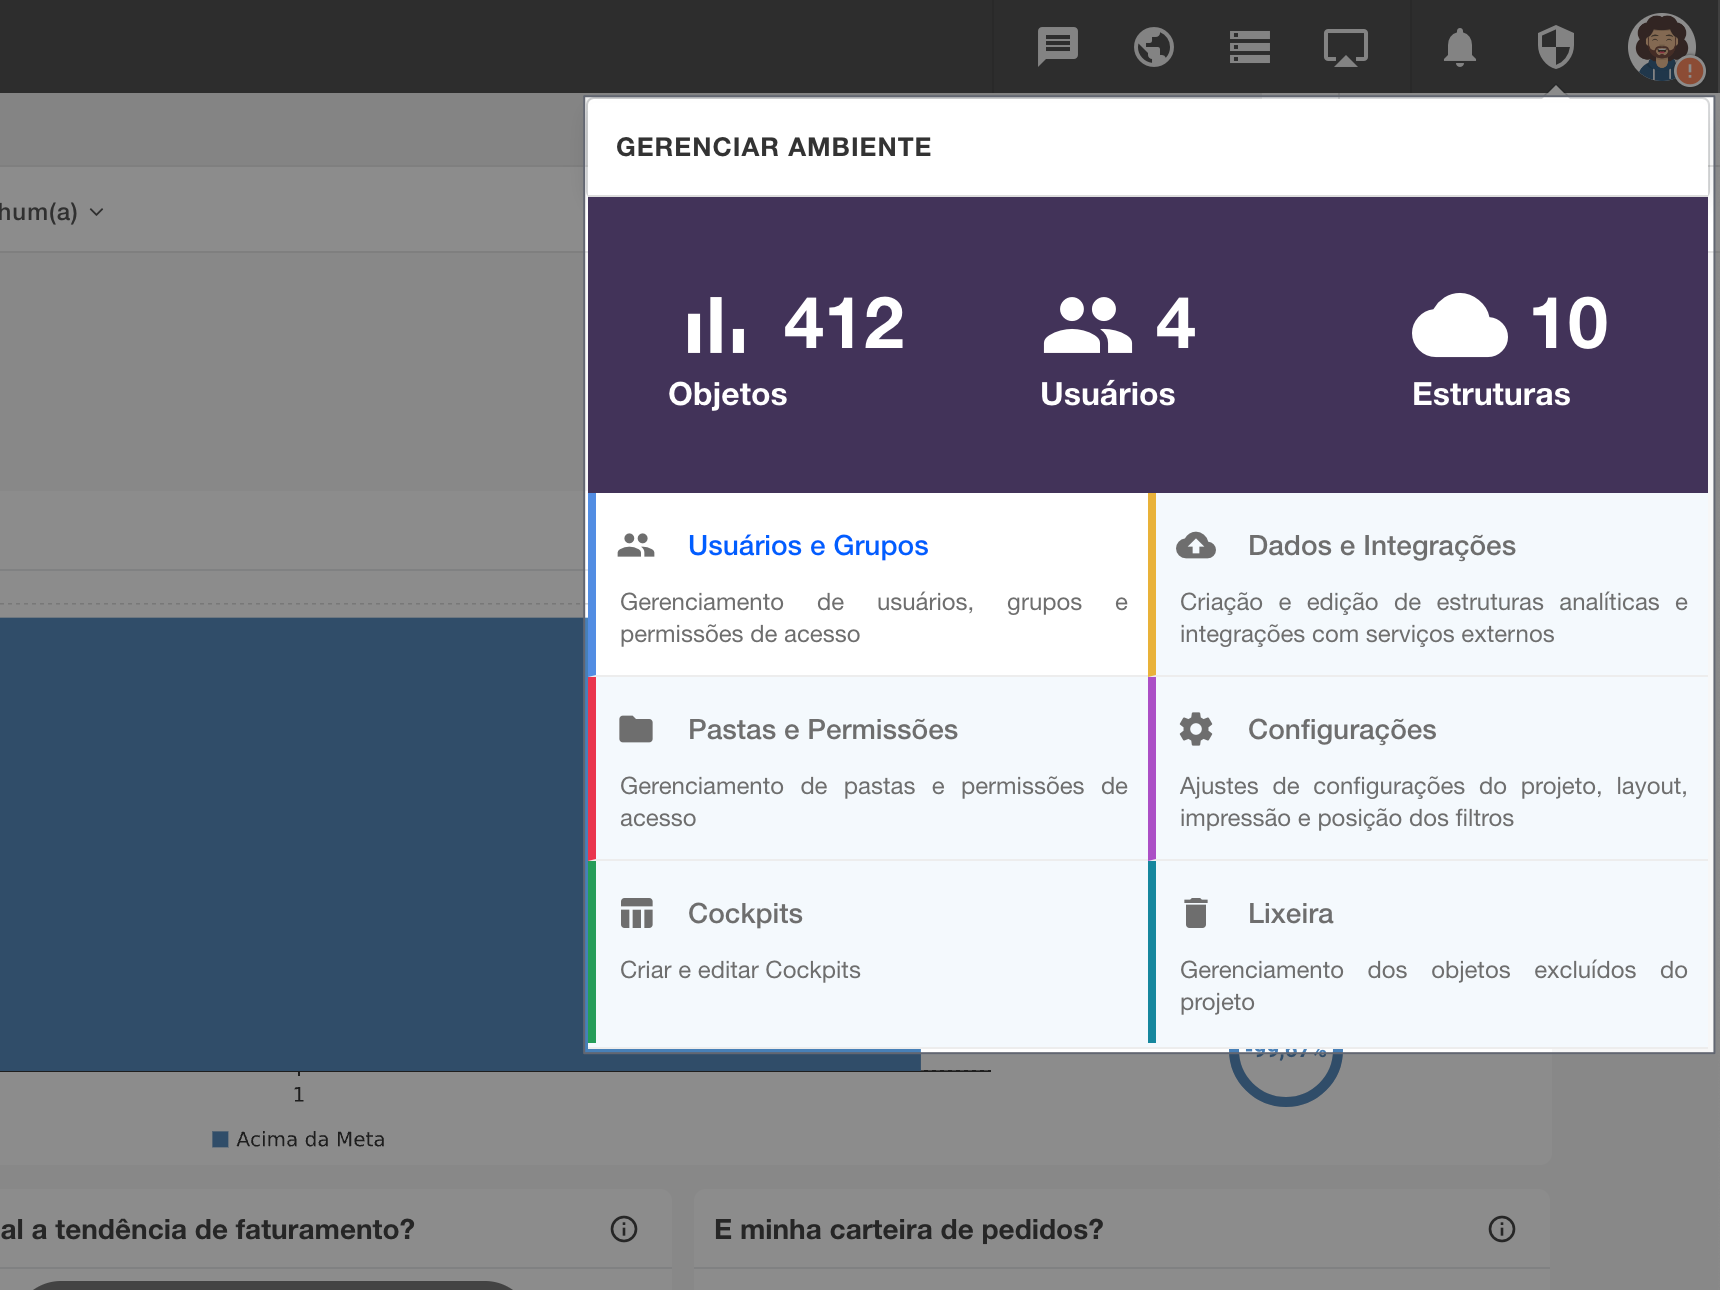
Under “Users and Groups” click on the “+” icon and then on “Invite users”.
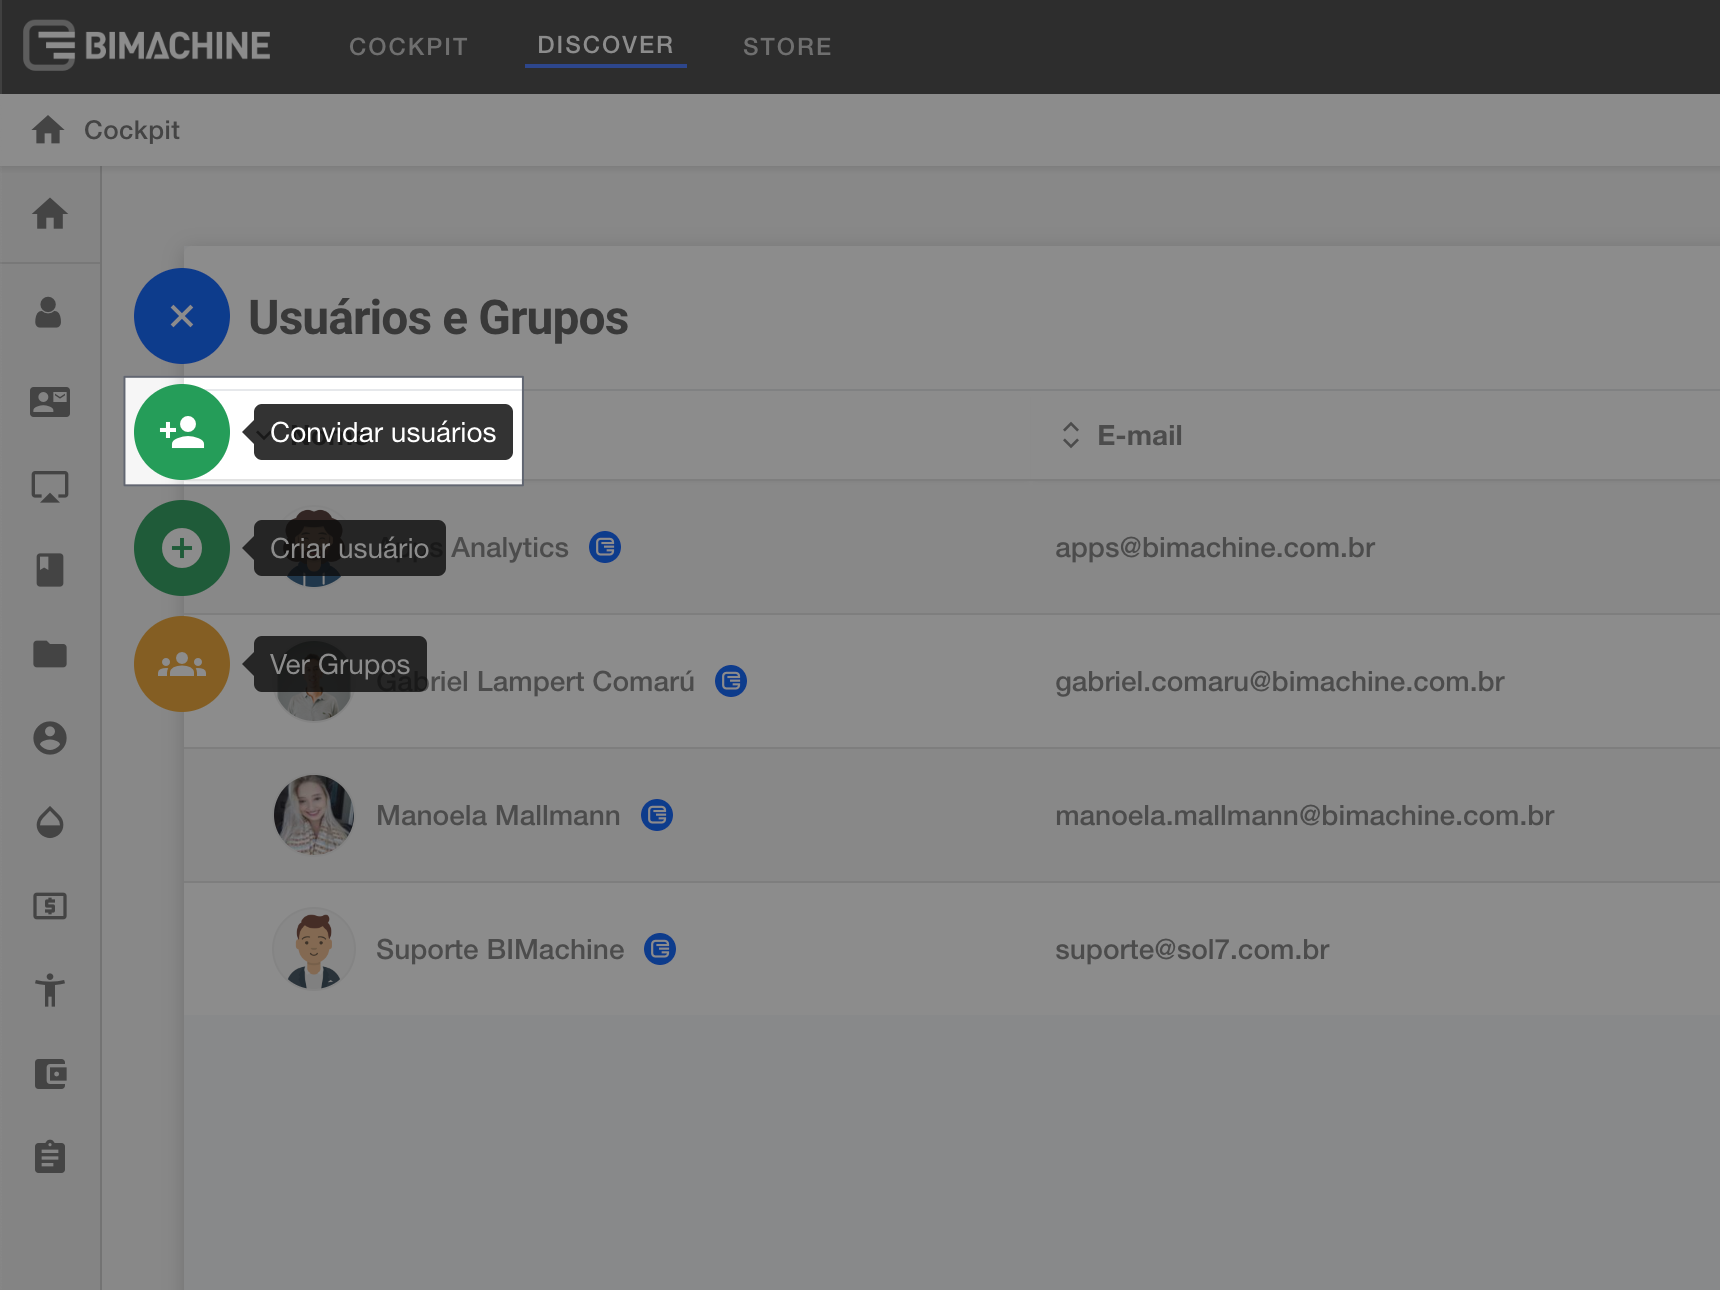
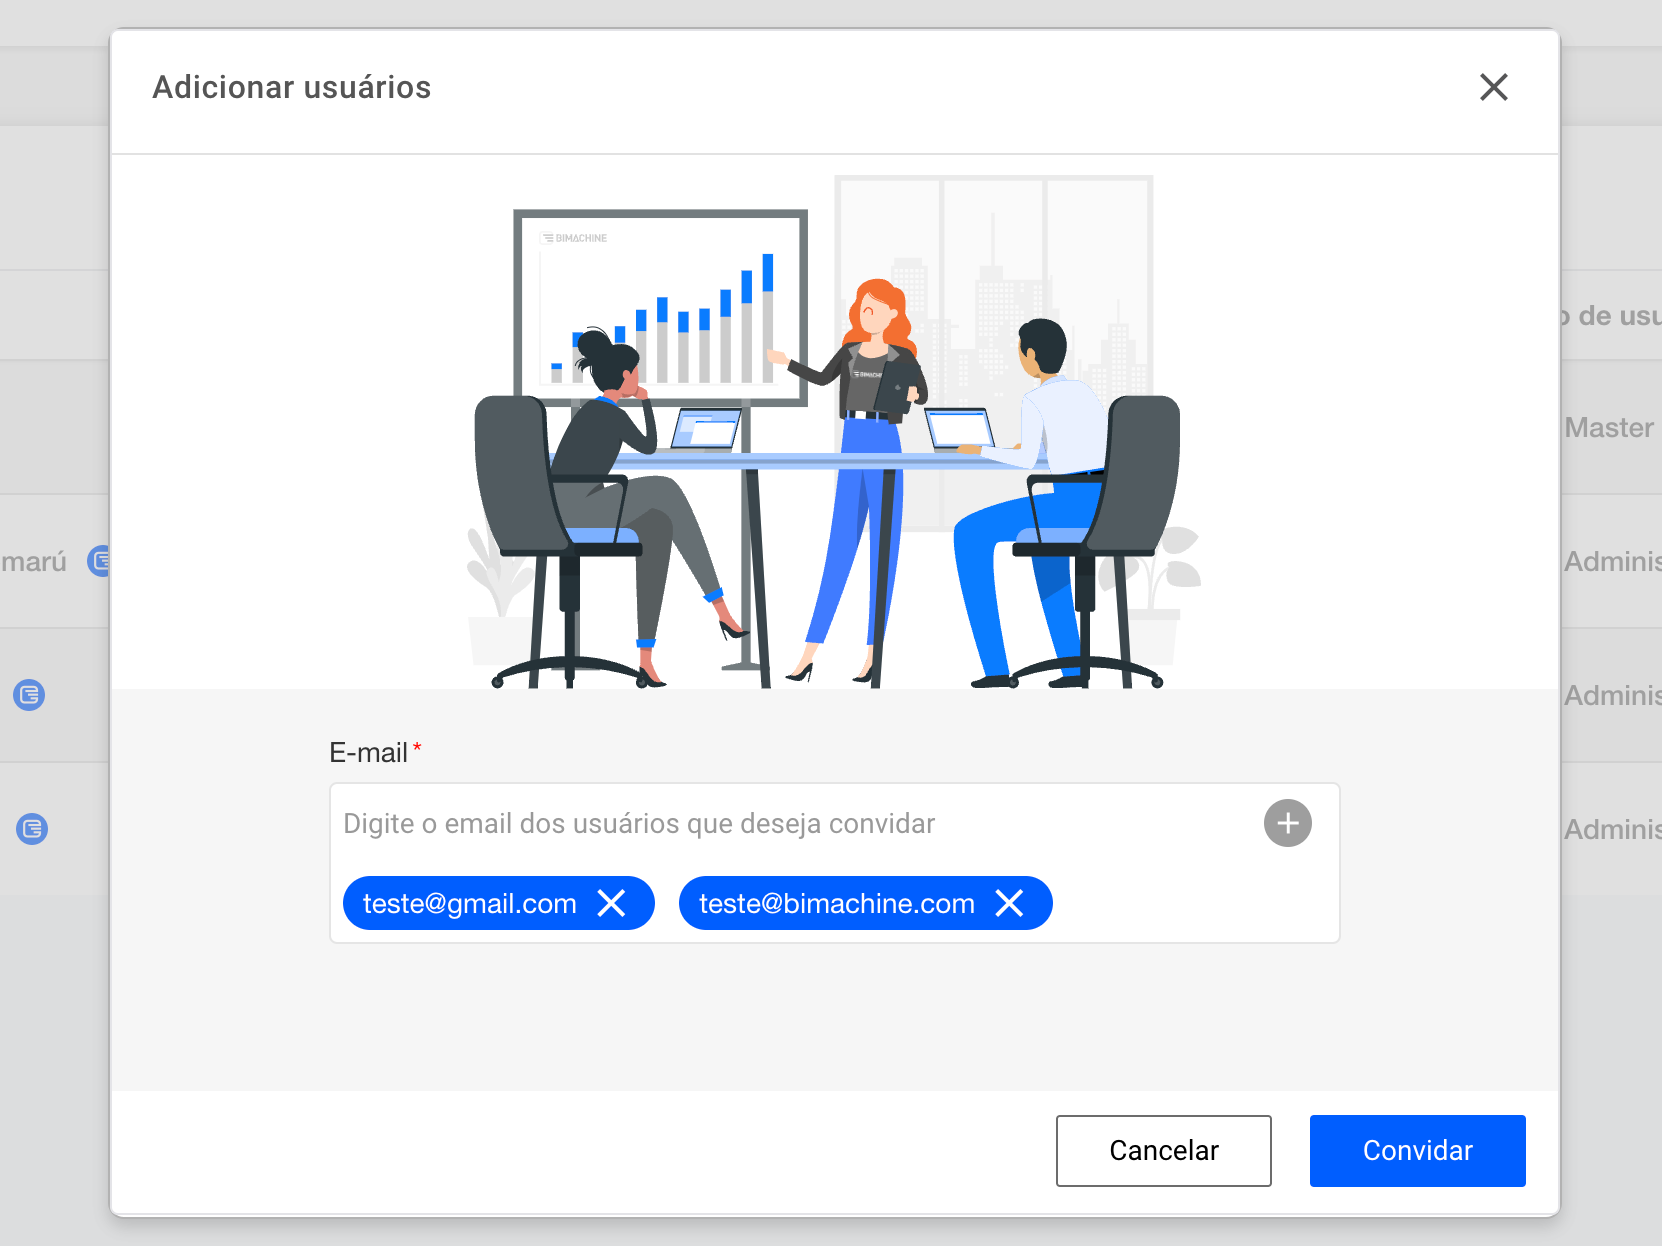
The user invitation screen will open, where you can invite multiple users at once, just enter the email address and click enter for each user you want to invite.
