
What is granularity?
Granularity refers to the size into which the data fields are divided. The more subdivided and granular the data is, the more detailed it will be.
Example: The data "address" complete with street, number, apartment, house, neighborhood, city, state, county and zip code, is not very granular. But this separate data brings granularity to the information. That is, separated they bring more information than summarized. Another example is in a sports race, if the final result were per minutes, there would be divergences, since many times they are calculated by seconds and even by milliseconds.
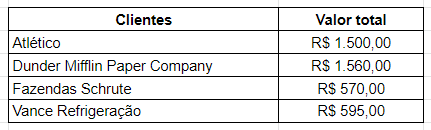
In the example below we will use a sales scenario, in which there are customers, products, and the total value of these products.
Analyzing the spreadsheet we realize that its granularity is very large, which ends up reducing the information. The only information it has are the customer names, the total value of all customers together, and the total value of each customer separately.
In order to do a more detailed analysis, we have to decrease the granularity. Let’s take a closer look at the information from the Atletico establishment. Now we can see which products were purchased, the unit price of each product, the quantity of each product and the total value.

So when it comes to granularity, we have to think about what information is important to have. You have to pay attention that the granularity is not too low, because you may end up losing important information. You also have to be careful that the granularity is not too high, so that you don’t group not-so-useful information that will hinder the visualization of other data.
Drill down and Roll up
These refer to the levels of our analysis. When we talk about decreasing granularity, we talk about Drill down, which is increasing the level of detail. When we talk about increasing granularity, we talk about rolling up, which is to decrease the level of detail.