
In this topic we’ll show you the functionalities that exist when we create/edit a KPI when we get to the last part. Structure
The structure is defined as follows:
- Title: above the value, a title defining the KPI.
- Subtitle: below the value, a subtitle for the KPI.
- Templates: lists the existing templates for the KPI.
Definitions
In the definitions, we define the following:
- Enter a prefix to accompany the value (e.g. R$40.40).
- Enter a suffix to accompany the value (e.g. 40 ºC).
- Is it a percentage? Select if it is a percentage instead of a value (already checked if the selected measure is a percentage).
- Summarize values: If it is not a percentage, it will summarize long values (e.g. instead of showing “1000000”, it will show “1mi”).
- Decimals: If it is a percentage (this is how it will appear), you define how many places you want to have after the decimal point.
- Color: Defines the color of the KPI (If you use bands on the “Target Value” tab, this will not be applied).
Target values
In the target values, we define the following:Type of indicator: presenting and calculating the target in two ways.
- Increasing: When the KPI calculates growth from the target.
- Decreasing: When the KPI will calculate growth inversely from the target.
Source Type: obtaining the goal in two ways.
- “Fixed Value”: defines a value for the target.
- “Measured Value”: defines another measure as the target.
- Use targets: make the KPI change color according to the value it reaches (e.g. blue 10%, yellow 30%, red over 50%).
- Measure: If you chose the “Measure” source type, select the measure you want to define as the target.
- Value: If you chose the “Fixed Value” source type, enter the value of the target you want.
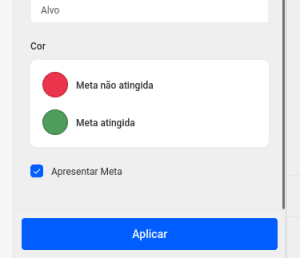
- Target color: you can define a color in which the KPI changes to the desired color when it reaches the target value. Without having to use the band.
- Ranges: If you have chosen to use ranges, you will be presented with 4 fields to show target growth.
- 1st to 2nd field: the KPI will turn red (as shown in the image below).
- 2nd to 3rd field: the KPI will be yellow (as shown in the image below).
- From the 3rd: the KPI will turn green (as shown below).
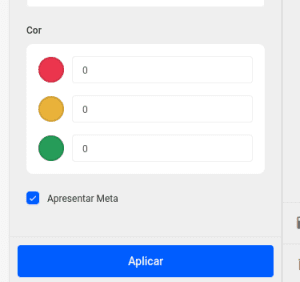
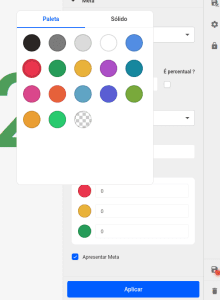
Remember: you can change the color of each strip.
See more about KPI: