The Expert Operations feature is a way to create custom operations and formulas in an analysis. See below the 4 types of operations and how to create each one.
Important: at the end of this topic we will explain some things that you should be careful about.
Below, we will show the 4 types operation, in the end, getting an analysis like this below.
Free Formula
In the free formula you can create equations and formulas with measurements and dimensions. We have two side tabs, in them we have:
Formula: value or information that you will create with a formula.
- Name: name of the Operation that you will display in the analysis.
- Order: order you want to display this operation along with the other created.
- Metrics: are measures that you can use in your formulas.
- Formulas: are the formulas that you can use with the measures.
Formatting:
- Mask: type of value you should display. Example: currency, percentage, etc.
- Customize: you can customize this mask. Example: "#,##0.00", 0.00% and R$#,##0.00.
- Value Range: by setting a rule on the formula result, with this rule will display a color or icon.
Screen Actions:
- MDX: displays the MDX created by the formula you created.
- Preview: displays the result from the formula you set up.
- Cancel: cancels and closes the screen.
- Save: saves the formula and displays it in the analysis.
Example: let’s look at an example where I choose a measure and multiply it by another measure.
% Participation
Participation displays a percentage on the "Parent" value (the total of the dimension or in the top hierarchy of the dimension). But we can apply it in two ways:
Important: use over the dimension presented in the analysis, otherwise the result will always be 100% over everything.
Standard: The standard will show its percentage over the "parent" dimension
Accumulated: the accumulated shows the percentage on the parent dimension and added to the previous indexes, thus reaching 100%. But be careful: you must use it for value, quantitative, or percentage measures.
Attention: if you use different counting measures, it may not work properly, because it may exceed 100%.
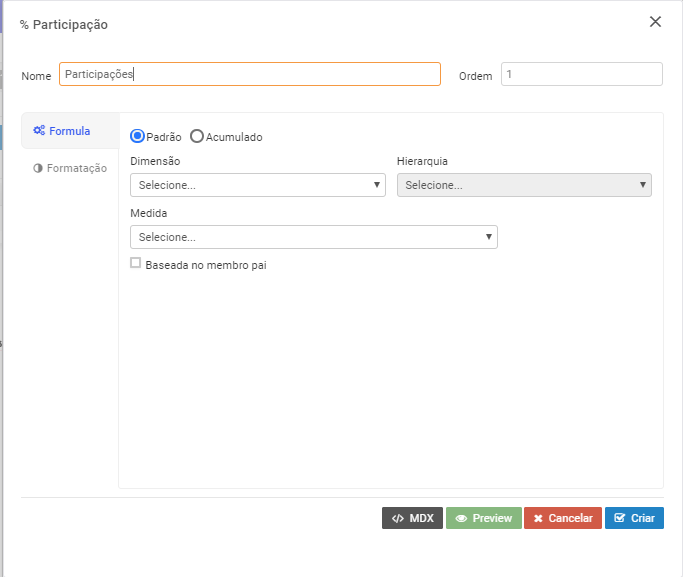
Formula: value or information that you will create with a formula.
- Name: name of the Operation that you will display in the analysis.
- Order: order you want to display this operation along with the other created.
- Dimension: are measures that you can use in your formulas.
- Formulas: are the formulas you can use with the measures.
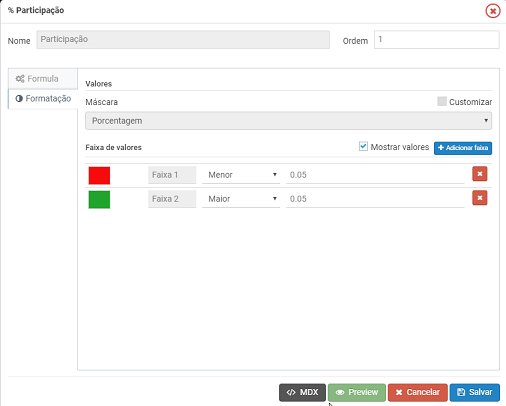
Formatting:
Value Range: defining a rule about the formula result. With that rule it will display a color or an icon.
Screen Actions:
MDX: displays the MDX created by the formula you set up.
Preview: displays the result from the formula that you set up.
Cancel: cancels and closes the screen.
Save: saves the formula and displays it in the analysis.
Example: let’s look at an example where I use the "Responsible City" dimension and the "Value" measure, which is already displayed in the analysis.
Agrupador
No agrupador você define um conjunto de informações de uma dimensão com uma medida.
Importante: quando marcar uma medida calculada e ocorrer um erro ao salvar, desmarque essa medida. Não é possível usar o agrupador em medidas que já estão em um agrupador ou que foram criadas a partir de um agrupador.
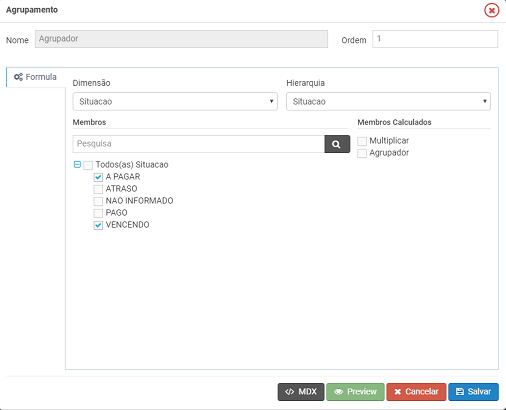
Ações da tela:
- Nome: nome da Operação que vai apresentar na análise.
- Ordem: ordem que deseja exibir essa operação junto com as outras criadas.
- Dimensão: selecione a dimensão que deseja agrupar.
- Membros: são as informações contidas na dimensão, selecione as que deseja agrupar.
- MDX: apresenta o MDX criado pela fórmula que você criou.
- Preview: exibe o resultado a partir da fórmula que você montou.
- Cancelar: cancela e fecha a tela.
- Salvar: salva a fórmula e apresenta na análise.
Exemplo: vamos a um exemplo que utilizo a dimensão "Situação", agrupando "Vencendo" e "A pagar". Fazendo isso veja que os valores são somados de acordo com as informações agrupadas.
Constantes
A constante é um valor fixo que pode auxiliar em um fórmula, bastante útil quando temos que usar em cada linha da análise.
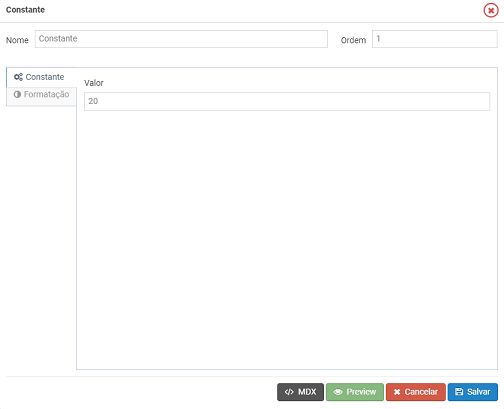
Fórmula: valor ou informação que vai criar com uma fórmula.
- Nome: nome da Operação que vai apresentar na análise.
- Ordem: ordem que deseja exibir essa operação junto com as outras criadas.
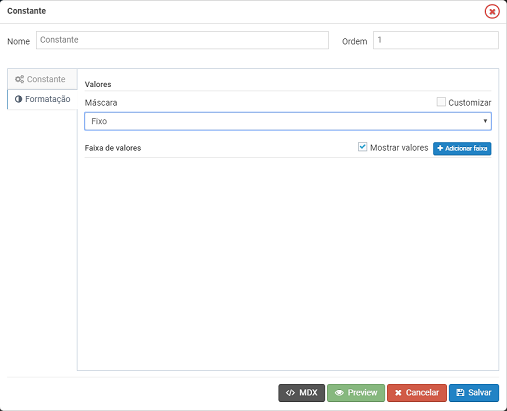
Formatação:
- Faixa de valores: definindo uma regra sobre o resultado da fórmula, com essa regra vai apresentar uma cor ou um ícone.
Ações da tela:
- MDX: apresenta o MDX criado pela fórmula que você criou.
- Preview: exibe o resultado a partir da fórmula que você montou.
- Cancelar: cancela e fecha a tela.
- Salvar: salva a fórmula e apresenta na análise.
Exemplo: vamos a um exemplo que utiliza o valor 20.
Alguns cuidados:
- Se você marcar a customização e selecionar a opção como "Percentagem" (no MDX é "Percent") e utilizar uma faixa, não vai funcionar, pois a opção possui um tratamento quando utiliza uma faixa e o "Percentagem" se torna "|0.00%|", então se utilizar uma faixa, não marque a customização, dessa forma as faixas vão funcionar.
- Se suas faixas criadas não atenderem algum dos valores na análise, ele vai aplicar a última regra criada da faixa.
- Quando usar a medida do tipo "Hora", não será possível colocar cores ou ícones. No momento que inserir uma faixa quando tiver marcado a tipo "Hora", será posto como "Fixo".

