
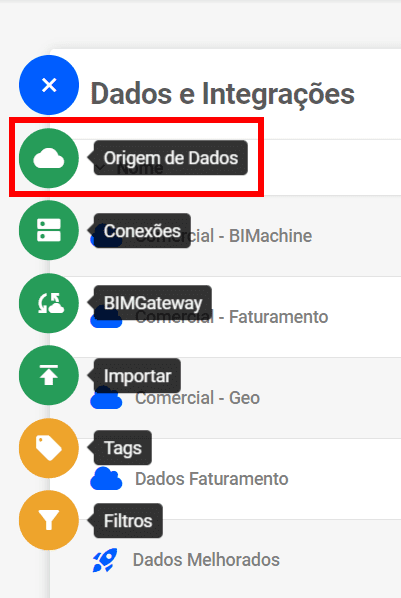
To create a uMov.me structure, access the icon or “Manage Environment,” then click on “Data and Integrations.”

Next, click on the “+” and then on data source.
A screen with connectors will open. To create your data source with a CSV file, click on “uMov.me.”

A screen with six steps will open. The first step is “Information.” To create a new data structure, enter the following:
- Display Name: name of the structure.
- Description: a brief description of the project, if you wish to include one.
- Keep Data History: There are two types of loads, Total and Incremental. If you check this option (Keep Data History), you will not be able to perform a total load, i.e., you will not be able to clear the structure. It will no longer be possible to remove data that has already been entered, only to enter new data.
- Icon: Here you can customize and choose an icon that is consistent with your structure.
- Group: You can leave the structure in a group, organizing the structures by separating them by group.
- Structure type: There are two types: analytical and data.
- Analytical: Create objects from the information in this structure.
- Data: Serves as support for creating a more complex structure (it is not possible to explore the data).

Here you will specify the connection management. If you do not have one, click on “Create new data connection.” Once you have created one, you can use it in other structures. To learn more about connection management, go to Data Connection.
On this screen, you will specify:
- User
- Password
*More details can be found at Umov.me by clicking here
Some actions are possible on these screens:
- Generate BIG TABLE format (select button): defines the structure that stores the source data.
- Checked: slightly slower loading, but with faster access to objects and more agility in changing them.
- Unchecked: faster loading, but with slightly slower access to objects and some slowness in changes depending on the dimension used.
- Standardize data (select button): this is already checked, and you can define this standardization in the next step. If you uncheck the “standardization” step, a new step is not performed.
- Validate query: validates the SQL you will use to bring in the data, thus ensuring that it does not contain errors.
- Data Preview: if you want a preview of the returned data that will go to the structure.

On the next screen, “Structure,” we will configure the fields:
- KEY: Allows you to select a key field for the structure. This field is used in incremental loads to control records that have already been inserted.
- Field: the “real” name of the field, to use as a reference in a calculated measure or anything else you want to do in MDX.
- Display Name: you can modify this field even when editing, leaving spaces and capital letters to create the name of the dimension you will see.
- Dimension Type
- Regular: making a descriptive dimension in objects.
- Time: making a time dimension in objects, which can be used as a periodicity filter.
- Measure: making the value in objects.
- Georeference: making the location in Map objects.
- Filter only: making the filter to sort on a dimension (very useful in income statements, balance sheets, and cash flow statements).
- All: if unchecked, when selecting the dimension, it is already listed and not grouped. CAUTION: this may take time and even freeze the object when accessing it, depending on the amount of information from the source.
- Sorting: if you have chosen any “Dimension Type” such as “Filter only,” in the other information presented, you can use it as a reference for sorting.
- Operation: only when measured.
- SUM: adding the measurements as presented in the objects.
- COUNT: turning the measurement into a count and adding it up as presented in the objects.
- MINIMUM: bringing the minimum value on the information presented in the objects.
- MAXIMUM: bringing the maximum value on the information presented in the objects.
- AVERAGE: bringing the average value on the information presented in the objects.
- DISTINCT COUNT: Counts equal information, being a single piece of information, not ADDING when presented in the objects.
- Mask: only when measured.
- Standard: making the value as it is presented.
- Percentage: making and transforming the value as a percentage.
- Currency: making the value as currency. Example: “22.20” becomes “R$ 22.20”.
- Fixed: rounding the value even if it has a decimal place to an integer value. Example: 22.2 becomes 22 or 22.7 becomes 23 (rule of 5: when less than 5, round down; when greater than 5, round up).
- Time: making a value or information of the time type, with decimal places.

On the next “Hierarchies” screen, we can create dimensions with hierarchies by clicking on the “Create hierarchical dimension” button. See how in Click here.

The next screen will show a summary of all the information. When you click on “Finish,” all the data will be loaded into BIMachine for the source you defined.

If everything is correct, click on “Finish” and you’re done.