
To better understand the following content, we suggest that you already have knowledge of the topics mentioned in this documentation.
What is Google Analytics?
Google Analytics is a platform that collects data from your apps and websites to create reports about your business.
Logical Integrations
Google Analytics has a logic similar to the other connections made in BIMachine, however, the tool does not provide a pre-defined endpoint, but rather, provides all the metrics and dimensions, allowing the user to determine which fields they want to extract the information from. Based on this, we created some customized endpoints that we call Logical Integrations, each of which has a unique analysis proposal, and if you want to create your own structure, that’s also possible, through an individual Integration.
Access performance by day and time
The goal of this endpoint is to extract information at a minimum level of the hours of the day, thus making it possible to create analyses that help in the decision making process of which are the best times to advertise or boost campaigns.
Metrics: activeUsers, bounceRate, newUsers, totalUsers, sessions, sessionsPerUser
Dimensions: dayOfWeekName, hour, date
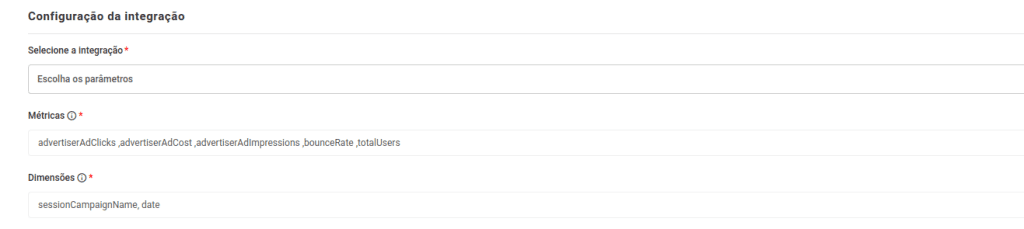
Performance of advertising campaigns
In this set of information it will be possible to analyze in a complete way all the individual performance of each of the campaigns, being also possible to analyze the result daily.
Metrics: advertiserAdClicks, advertiserAdCost, advertiserAdImpressions, bounceRate, totalUsers
Dimensions: sessionCampaignName, date
Engagement by device
With this endpoint you will be able to see how your content is being engaged on different devices, and analyze where your views are coming from.
Metrics: activeUsers, bounceRate, newUsers, totalUsers, sessions, sessionsPerUser, eventCount, eventCountPerUser, eventsPerSession
Dimensions: date, deviceCategory
User Engagement on Specific Events
Aims to see how the user engagement is in certain events, better understanding what the user’s behavior is inside your page.
Metrics: activeUsers, bounceRate, newUsers, sessions, sessionsPerUser, eventCount, eventCountPerUser, eventsPerSession, screenPageViewsPerSession, screenPageViewsPerUser
Dimensions: date, eventName
Access performance by location
Using this endpoint it will be possible to analyze the origin of your views by geolocation, being able to create interactive maps within the platform.
Metrics: activeUsers, bounceRate, newUsers, totalUsers, sessions, sessionsPerUser
Dimensions: country, date, region, city
Performance of Acquisition Channels
Aims to analyze the user origin, with this data you will be able to understand which origins are generating more attraction to your page and if these origins are from paid ads or organic traffic.
Metrics: activeUsers, bounceRate, newUsers, totalUsers, sessions, sessionsPerUser
Dimensions: date, sessionDefaultChannelGroup
Metrics per Day
The focus of this endpoint is to analyze the main engagement metrics on a daily basis, i.e. comparing their evolution over a period of time. It is also possible to identify user profiles and understand their recurrence within your site.
Metrics: activeUsers, bounceRate, newUsers, sessions, sessionsPerUser,averageSessionDuration, active1DayUsers, active28DayUsers, active7DayUsers, userEngagementDuration
Dimensions: date
Page Performance per Screen Class
Using this endpoint it becomes possible, for example, to compare which pages of your site are performing the most engagement, with analysis focused on hits, sessions and screen rejection rate.
Metrics: activeUsers, bounceRate, newUsers, totalUsers, sessions, sessionsPerUser, screenPageViews
Dimensions: date, unifiedScreenClass
Creating Individual Integrations
In addition to the pre-built integrations, you can also create custom integrations. In individual integrations, you put in the “Metrics” and “Dimensions” fields the metrics and dimensions of your choice. Then you just choose how many days you want to return and from which day.
Creating a structure
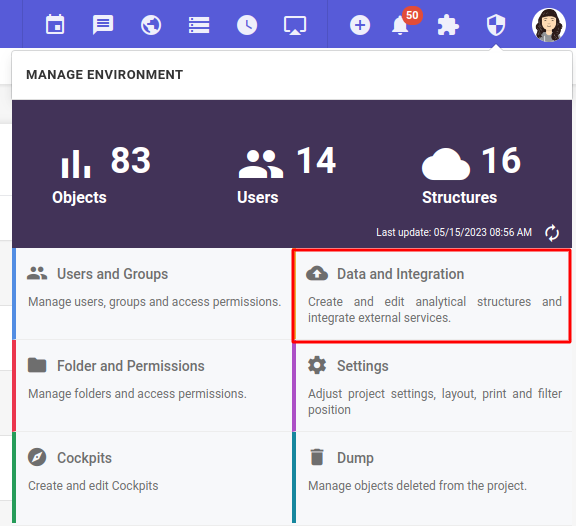
To create a Google Analytics integration, go to “Data and Integrations” under the “Manage environment” icon.
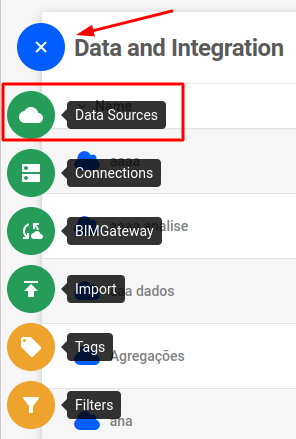
When accessing the Data and Integrations environment, click on the “+” icon, and then Data Source.
A pop-up will open, look for the Google Analytics integration.

You will be redirected to the screen for creating a new data structure:
- Name Display: name of the structure.
- Description: a brief description of the structure, if you want to put it.
- Keep Data History: There are two types of loads, Total and Incremental, and if you check this option (Keep Data History) you will not be able to perform the total load. In this sense, you will not be able to clean up the structure, because it is no longer possible to remove already entered data, only to insert new data.
- Icon: Here you can customize and choose an icon consistent with your structure.
- Group: You can organize the structures by separating them by group.
- Structure type: Option for analytical or data structure.
- Analytic: Create objects from the information in this structure.
- Data: Serves as a support for creating a more complex structure (not being able to explore the data).

On the next screen, enter the information below:
- Generate Distinct Model: Check to generate an optimized structure;
- Standardize data: Check to standardize the data;
Integration configuration:
- Ignore empty columns: check if you want to ignore empty columns;
- Select integration: select the integration that you want to analyze;
- How many days you want to return: number of days to return;
- From which date to load the records: date you want to start the days returned.
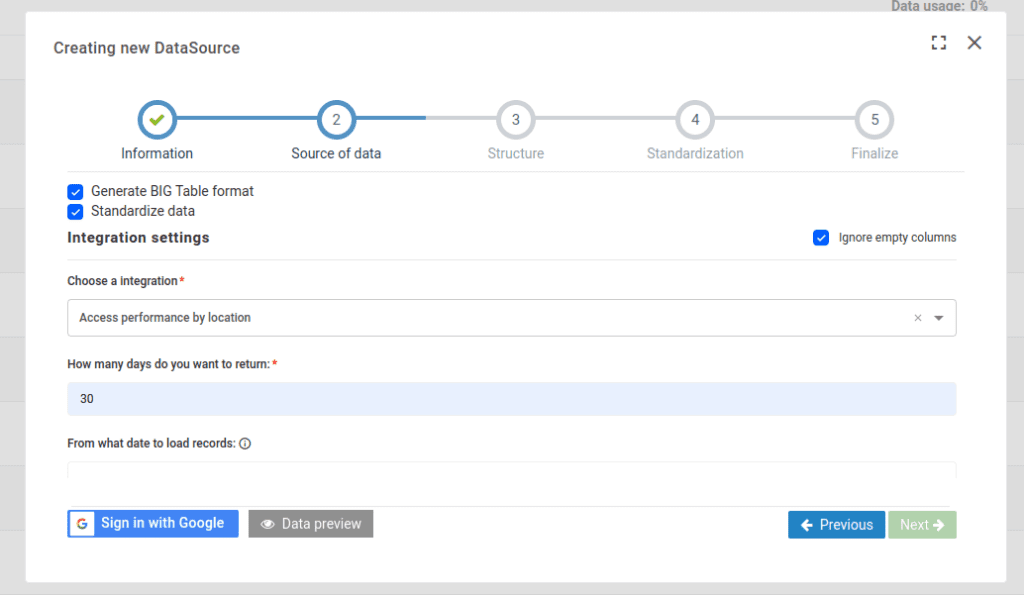
After that, sign in with Google to validate your credentials. If they are correct, you can now see the data preview.
Then all you have to do is to finalize the adjustments you prefer. If everything is right, your structure will be successfully created.