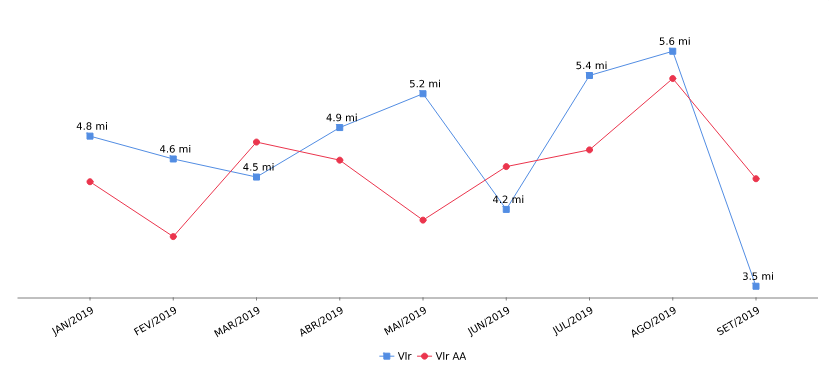
This analysis allows the comparison of months compared to its equivalent in the last year. It is a time series analysis with two lines that helps visualizing data and identifying seasonalities.

This analysis allows the comparison of months with their last year’s counterparts.
Parameters:
<Measures>: Name of the metric to be analyzed
<DateDimension>: Date dimension to be utilized
<Periodicity>: Dynamic date filter based on the level selected.

