Big Table is a new option for our table component, created with the aim of facilitating analyzes with large volumes of data and crossings. This dynamic and paginated table, in addition to providing better performance, brings several new opportunities for customization and personalization.
With it, it will be possible to create customized reports detailing the information currently contained in our clients’ dashboards.
Big Table brings some new features and facilities compared to analytics, including
- Possibility to choose the data source without the need to recreate the analysis.
- New UI to facilitate user experience when selecting measures and dimensions.
- Graphic indicator for filtered dimensions.
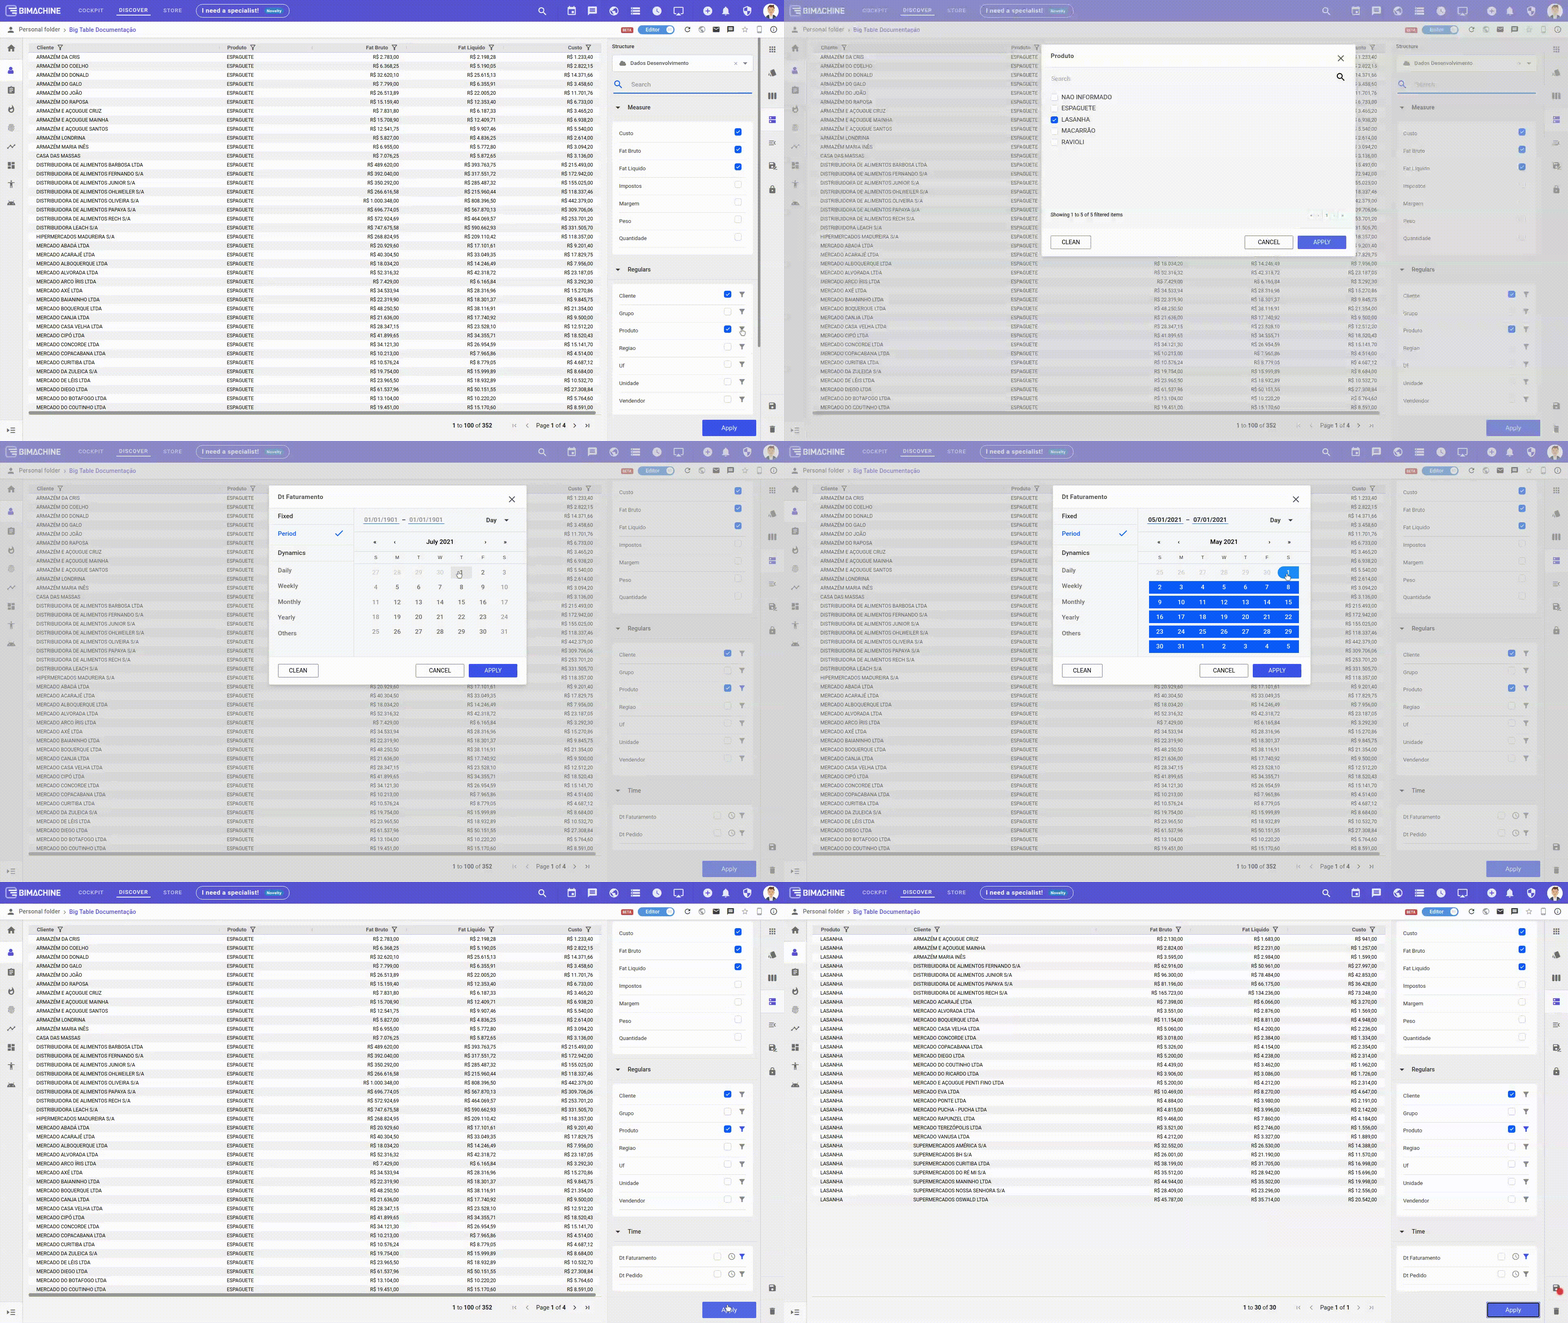
Creating a New Big Table
To create a new Big Table analysis, enter discover mode, and on the create analytic objects button (+) in the upper right bar, select the "Create analysis" option, and then choose the Big Table.
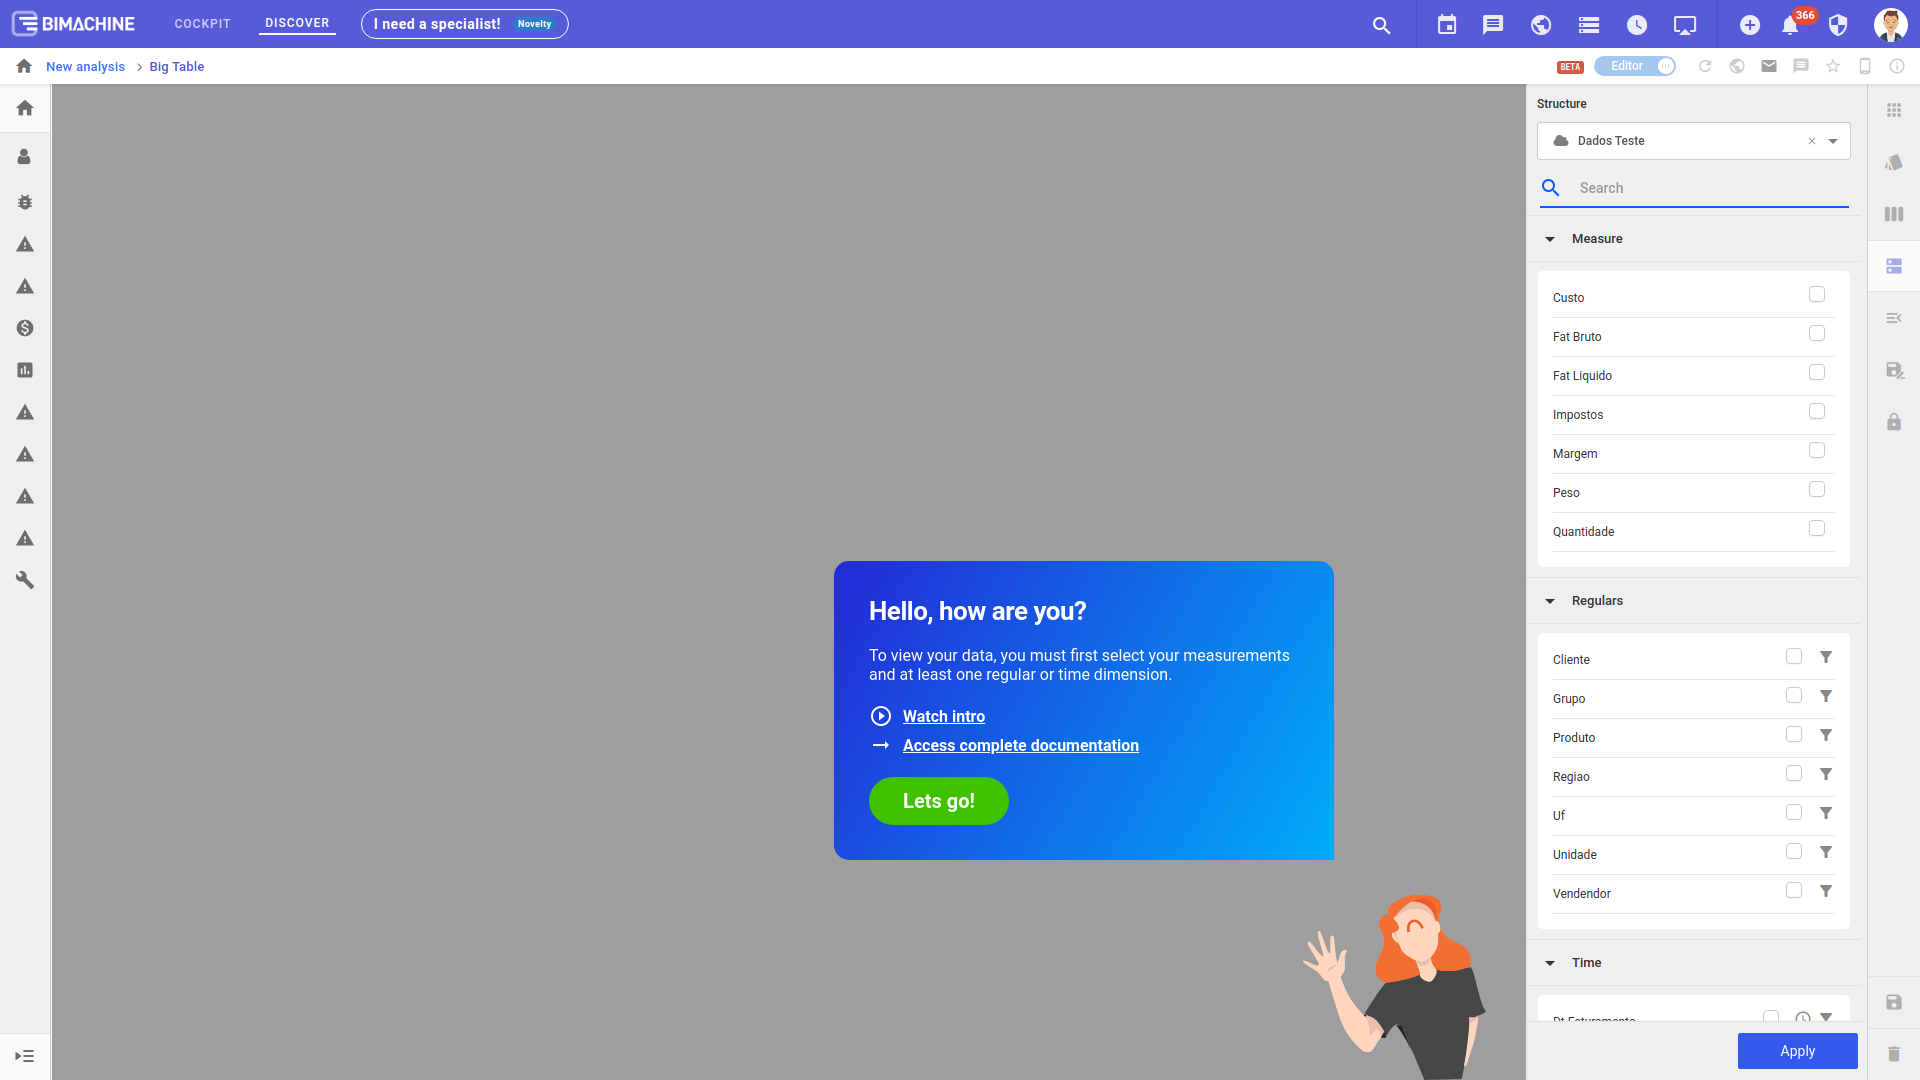
After choosing the structure, on the Big Table creation screen, we have the analytical menu open on the right, as shown in the image above. In this menu you define which measures and dimensions will compose your analysis.
- Measures: These are the metrics defined at the time of creating the structure;
- Regular: These are regular dimensions, through which it is possible to apply filters that facilitate the visualization of the data displayed on the screen. These filters can be added through the "Funnel" icon, present next to each of the measurements;
- Time: These are time dimensions that, like regular dimensions, can be used as filters for the data displayed in the analysis. It is also possible to define hierarchies that will modify the way the time dimensions are displayed in the table columns, only the year, months, weeks, days, etc. can be displayed… To define these hierarchies, just access the icon "Clock", located beside each of the time dimensions.
After selecting the measures and dimensions you want to display in the table, it is necessary to click on the apply button for the changes to be applied to the table. It is recommended that always, after modifications to the options for measures, filters or hierarchies, the apply action is performed again to ensure that the modifications made are effectively applied to the data displayed in the analysis.
Changing the data source
To modify the data structure used in your analysis, simply access the Data editing menu, located on the right side of the screen.
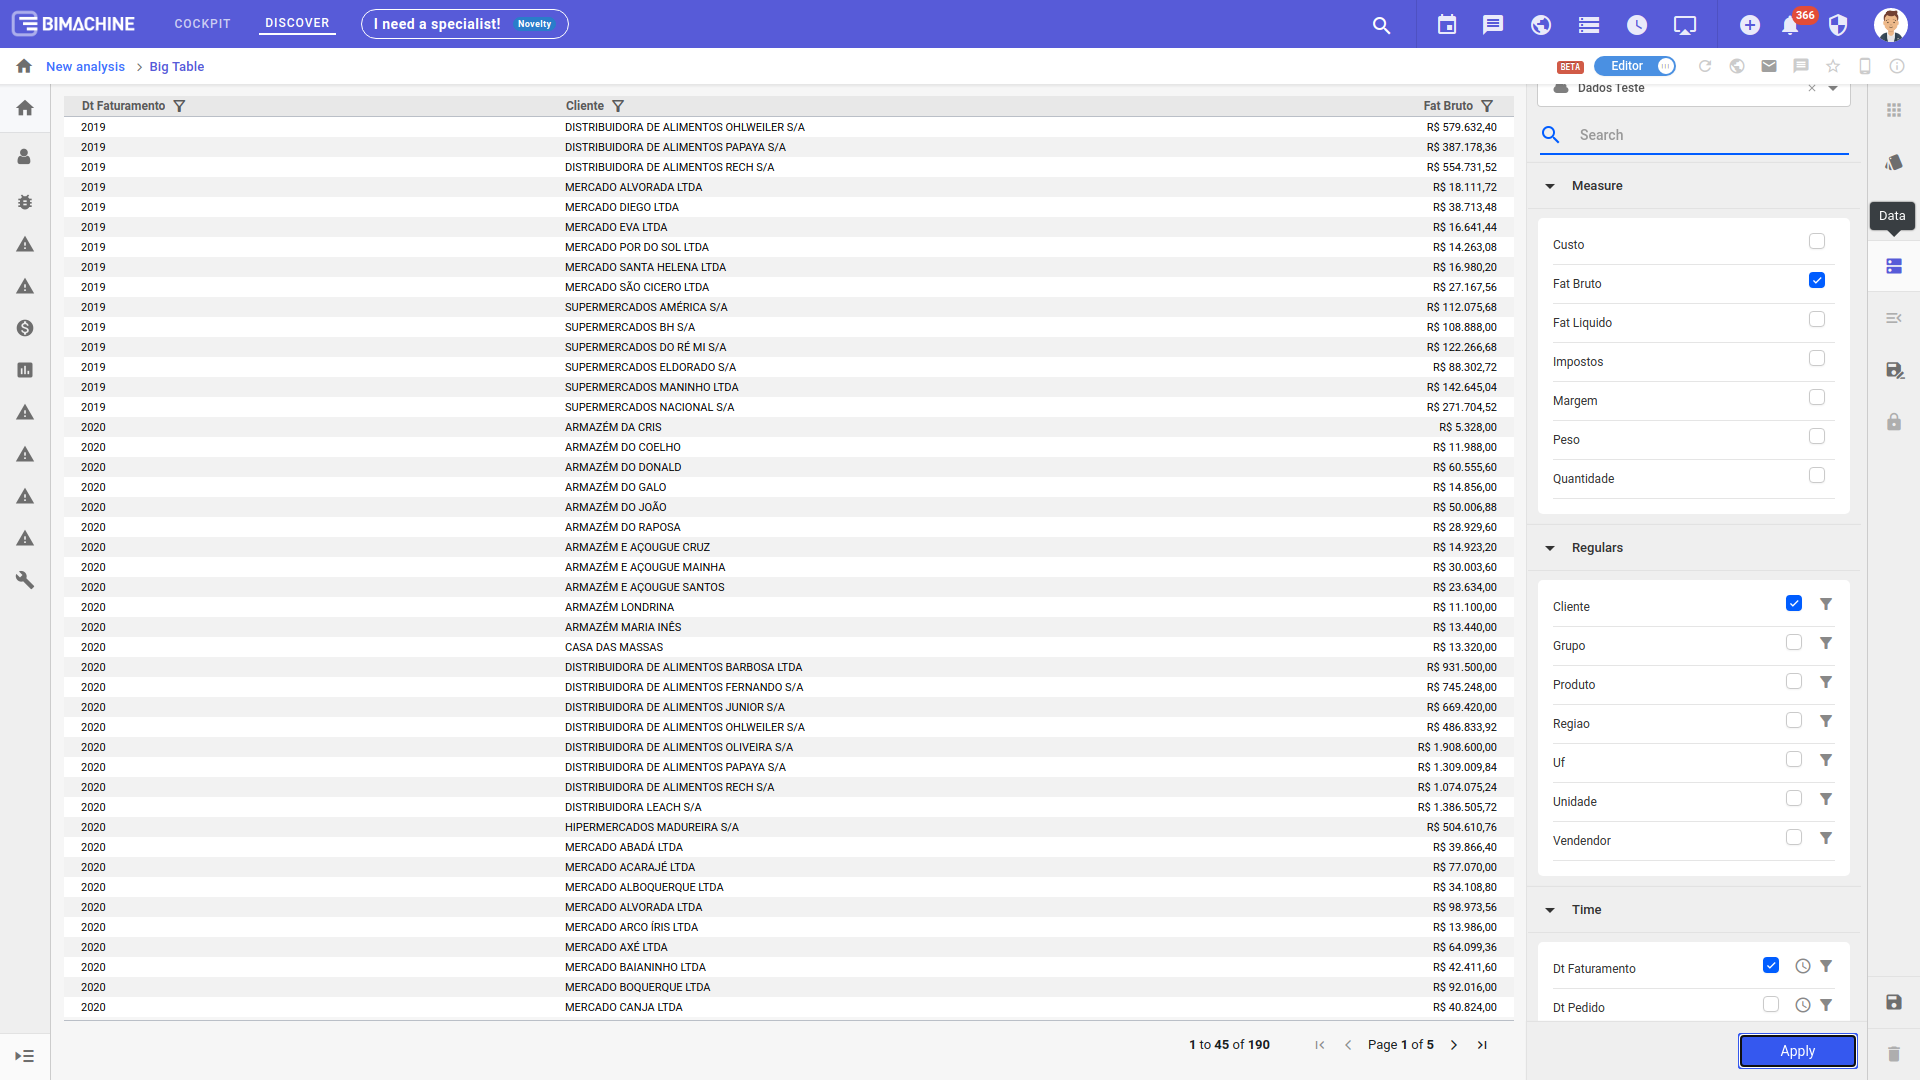
By accessing the menu, you can change the Big Table data structure by selecting a new data source in the structure selection dialog.
Filtering Big Table Data
Filter through dimensions
You can also filter data from the Big Table, showing only the data you want to analyze. You can access the filter buttons beside the Regular and Time Dimensions directly from the data choice menu for the table.
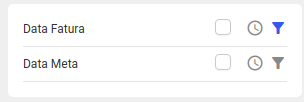
This button will be highlighted if any filters are active in the analysis. The filter application process is similar to the BIMachine standard, respecting the filter settings configured in the project.
Filter by column header
You can not only filter the data that will be used in the analysis, but you can also filter the results that the table brings you. In order to facilitate analysis of large volumes of data, you can individually filter the information that is relevant to you in the report columns.
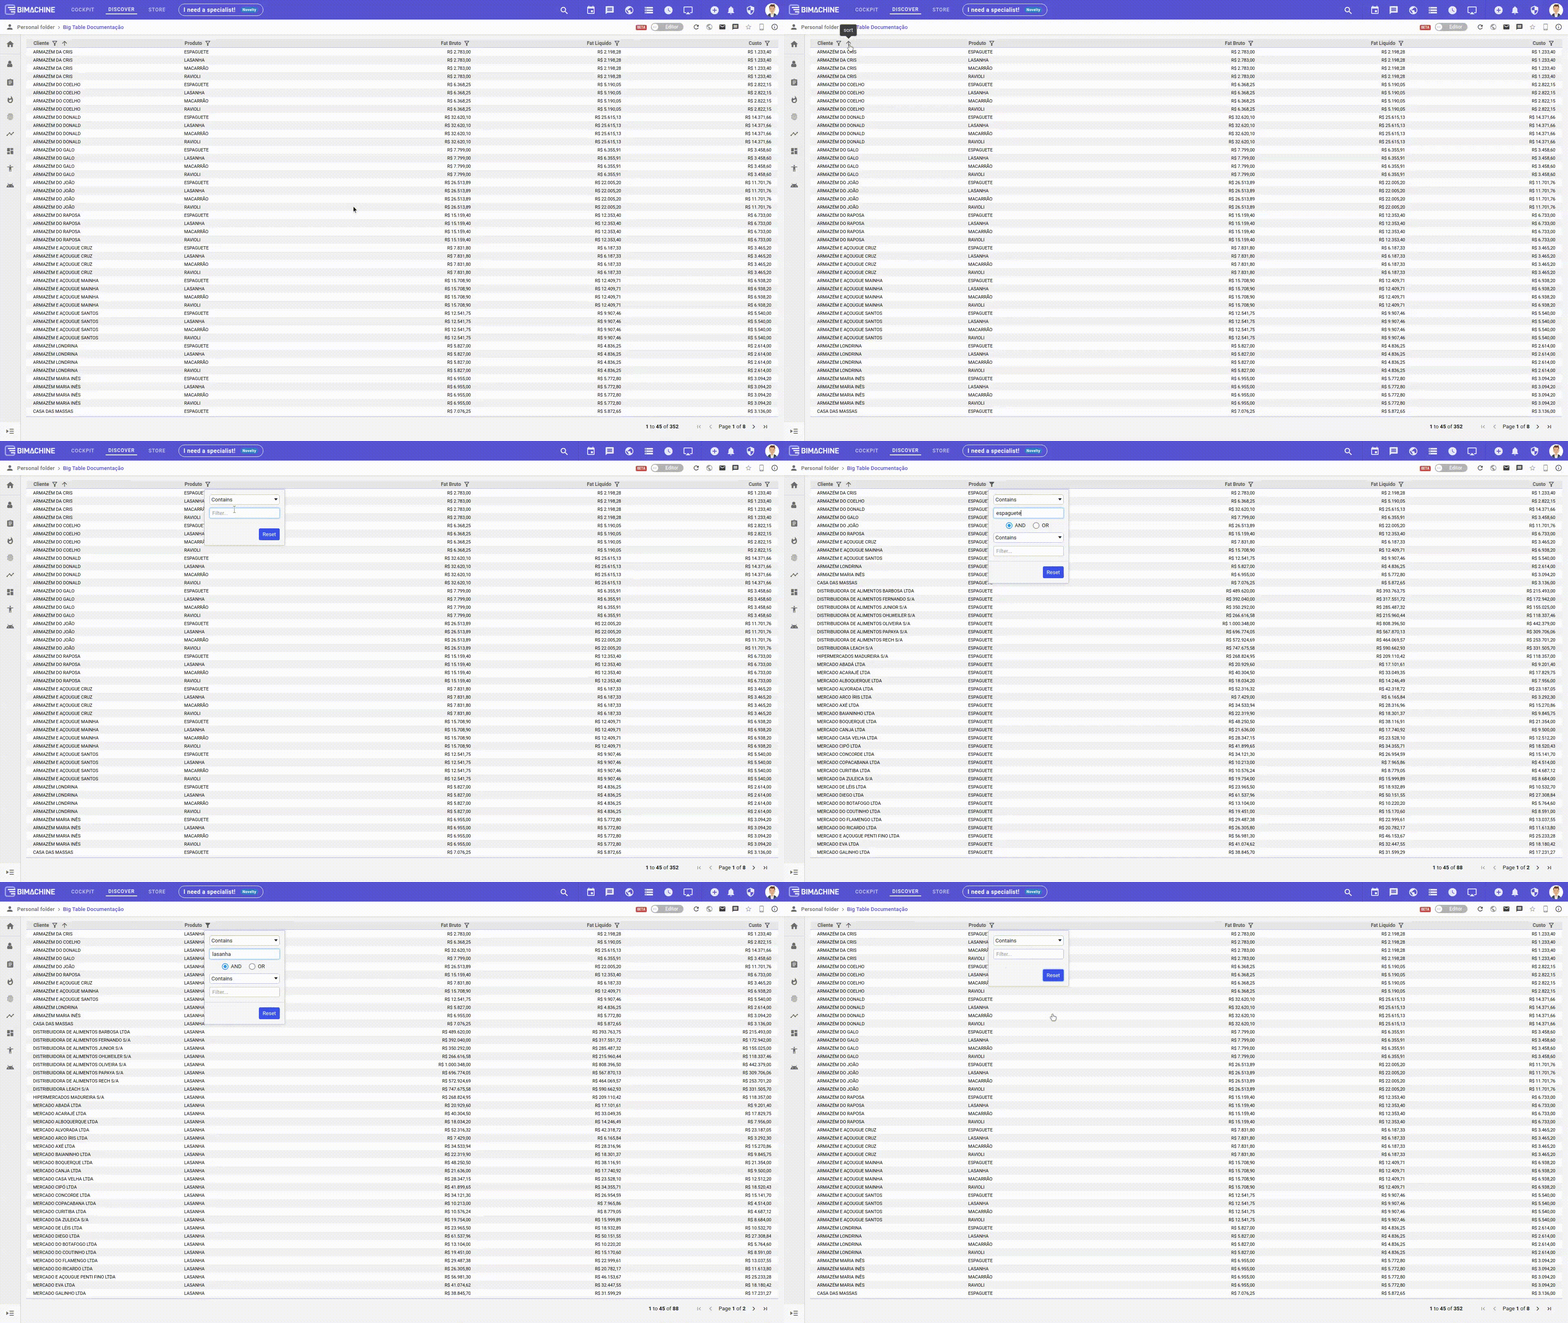
Table customization
Big Table brings several new table customization opportunities. In addition to applying themes already present within the BIMachine platform, the component allows the user to configure their own colors and default text settings for the table.
Layout customization
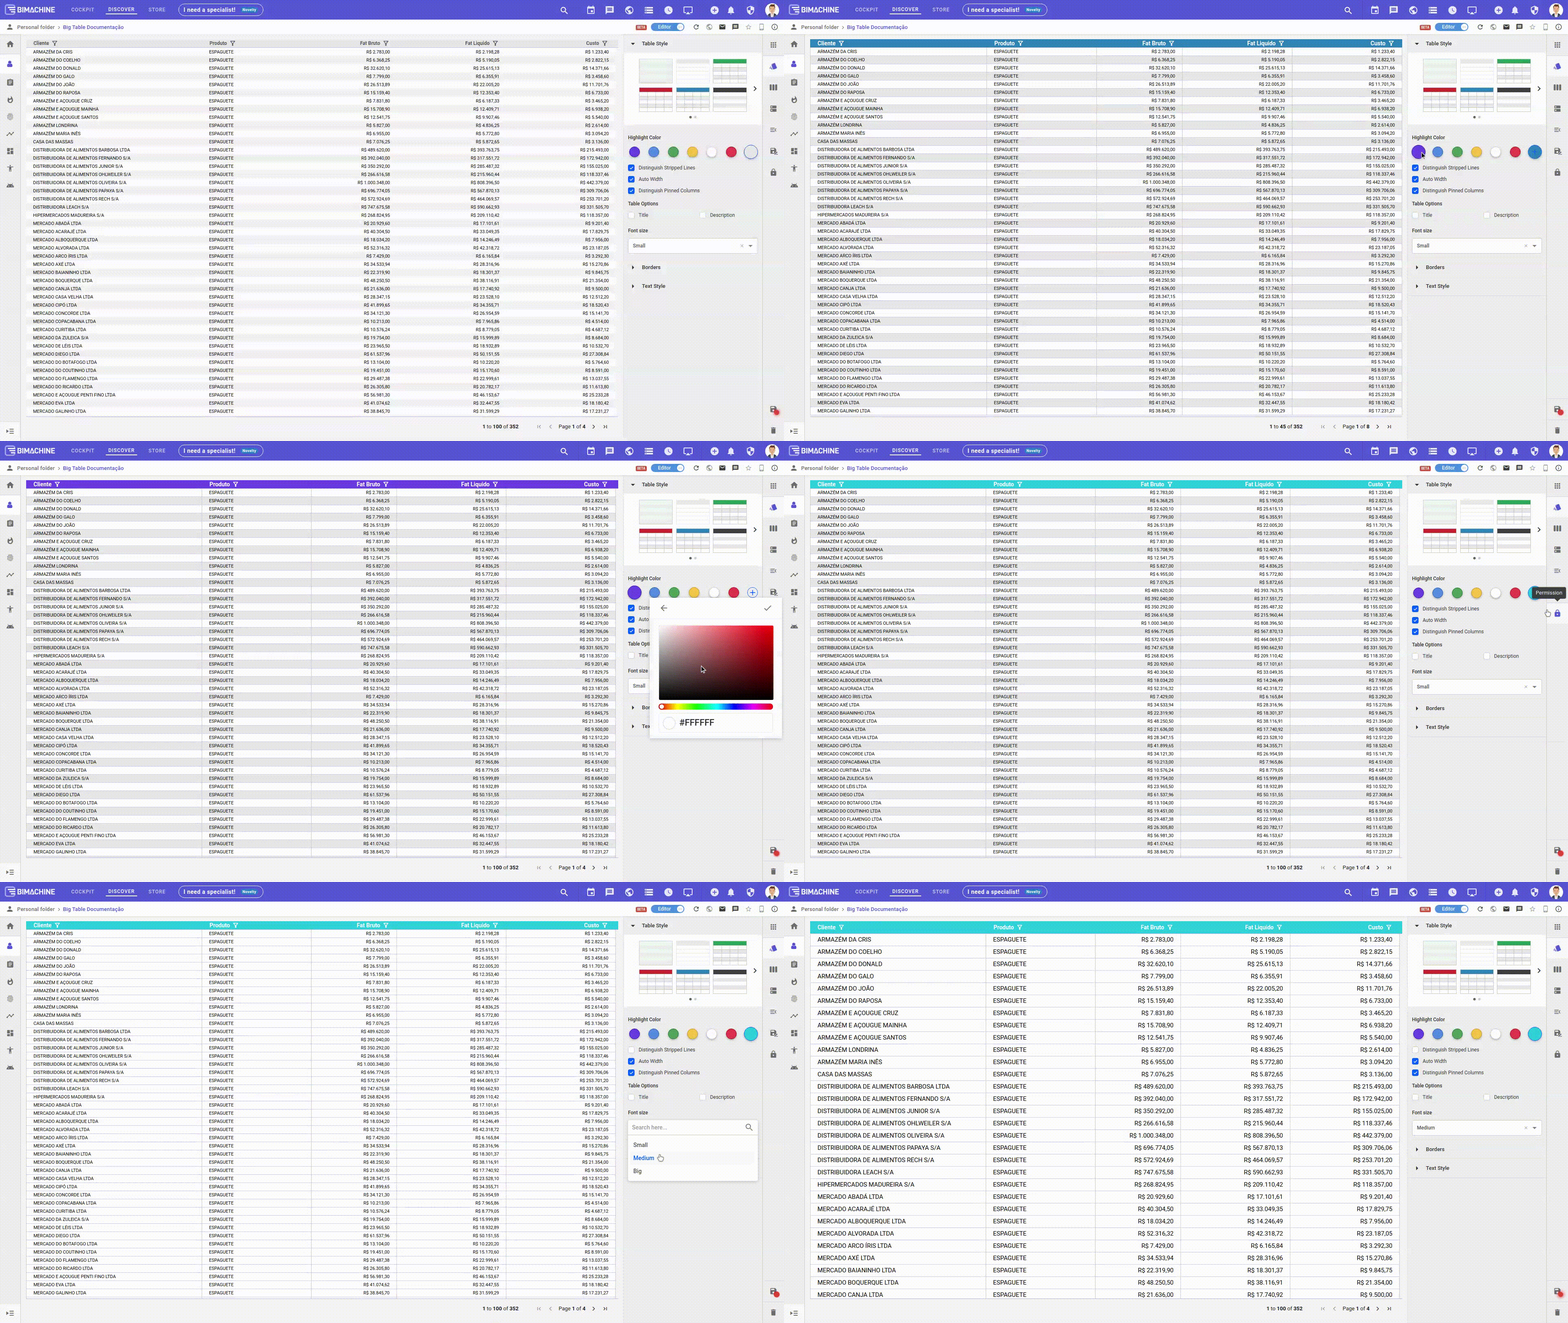
Through the Layout menu it is possible to modify the style of the table, using one of the predefined themes or creating a completely customized theme.
- Table Style: Offers 11 different predefined themes that can be applied to the table without the need for further configuration;
- Highlight Color: Color applied to highlighted rows, selected rows, table header and frozen columns;
- Table Options: Allows displaying or not the title and/or description of the table. To use these options it is necessary to assign a title and/or description in the "Text Style" menu;
- Font Size: Modifies the font size used to display data in the table. It has three sizes: Small, Medium and Large;
- Borders: Allows the modification of style, color and thickness of the table borders;
- Text Style: Allows individual customization of table items. Customizable items are:
- Title;
- Description;
- Body;
- Header;
- Selected line;
- Frozen columns.
Individual column customization
It is also possible to configure each of the columns individually via the "Columns" menu. It is now possible to reorder columns in the report, change column names and add conditional settings for each individual column very easily.
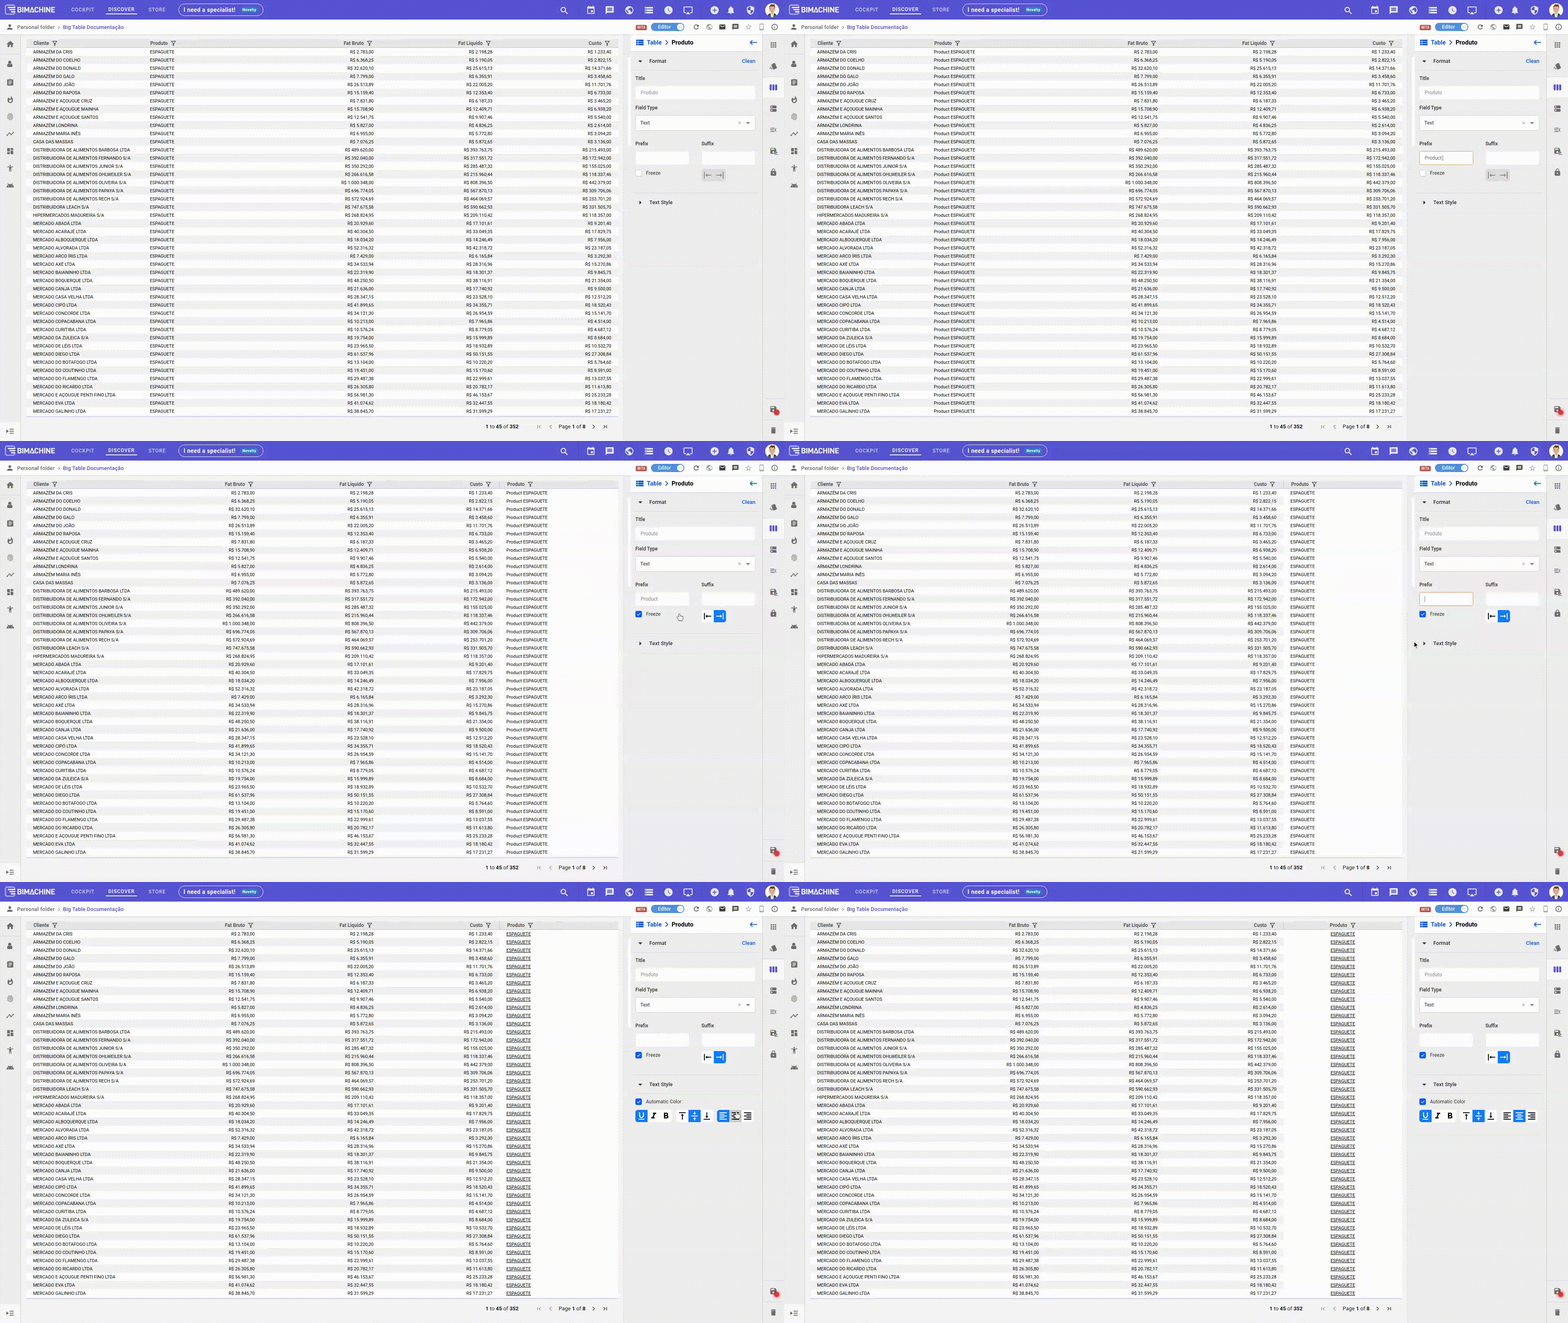
Among the customization options are:
- Title: Modifies the title that is displayed in the column header;
- Field Type: Offers the possibility to assign a type to the column, such as Numeric, Date or Text. Numeric type fields also offer the possibility of assigning a format (Standard, Number, Currency, Percent and Time) in addition to the number of decimal places to be displayed for the column data;
- Prefix and suffix: Allows adding prefixes and/or suffixes to the data displayed in the table;
- Freeze: Offers the possibility to lock columns at the beginning or end of the table.
- Text Style: Allows customization of the way text is displayed in table cells, among the available options are:
- Font style (Underline, Italic and Bold);
- Vertical alignment (Top, Middle and Bottom);
- Horizontal alignment (Left, Center and Right);
- Indicators: Allows customization of numeric type columns according to their content. Available options are: Fixed, Gradient and Ranges;
Indicators
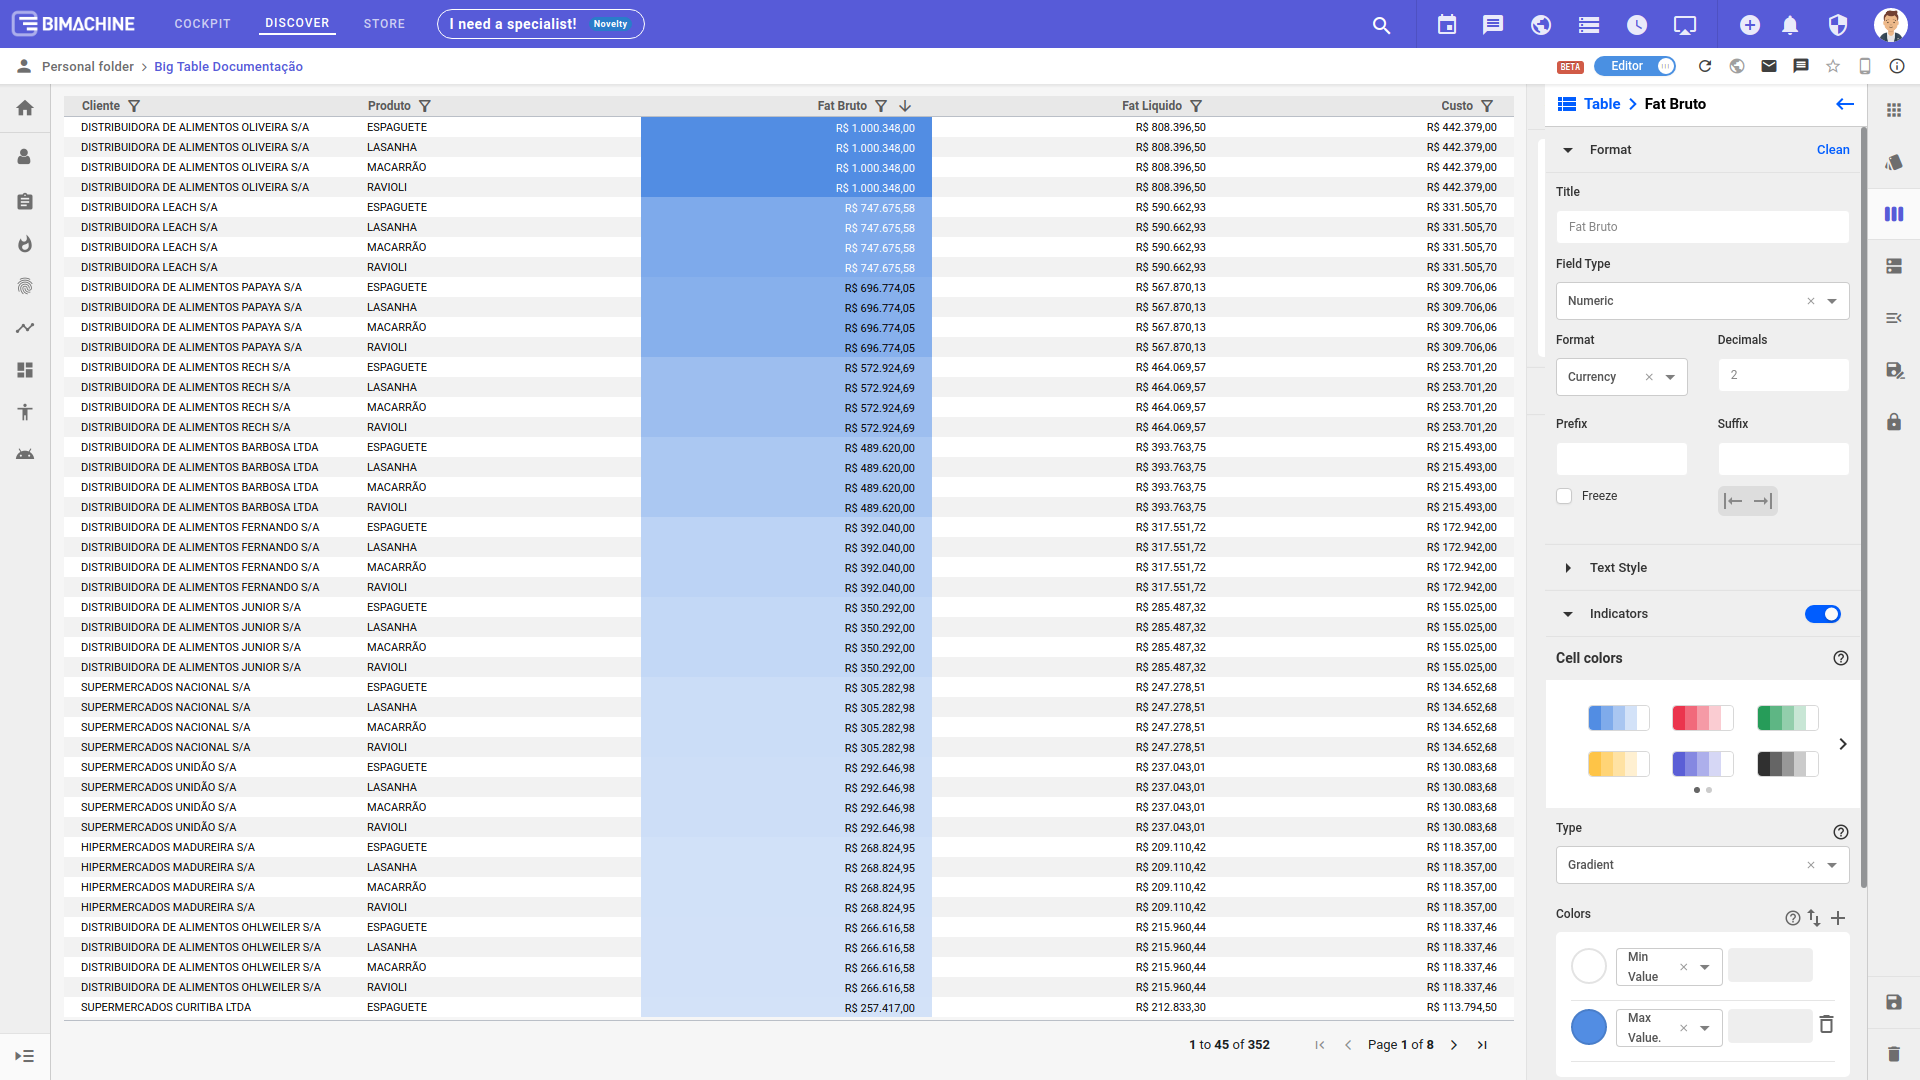
By enabling the indicators present in numeric type columns, we have access to a whole new range of possibilities for customizing the cell and font colors displayed in each column of the table. The available options for the types of indicators are:
- Gradient: Allows you to choose a gradient for a column, according to some criteria;
- Ranges: Allows the creation of conditional ranges, according to column values.
- Bars: Allows the visualization of bars in each column cell according to a predefined criterion. These criteria are available in the "control" selection box, they are:
- Fixed value;
- Percentage on measure;
- Measure;
- Percentage on maximum;
- Percentage of sum;
- Percentage over average.
Cell color
Depending on the type of indicator chosen, different ways of customizing a cell color are offered.
Gradient type indicators offer the following options:
- Color scheme selection: 12 different gradient color scheme options are offered that can be used without the need for additional settings;
- Colors: Allows the configuration of the colors to be used in the gradient according to the content present in the cell. Possibilities are offered to use Minimum Value, Number, Percentage or Percentile as a basis for defining the color to be used in the cell.
For indicators of type Ranges, it is possible to configure the colors to be used for each range of values present in the cells. In these indicators, there is the option of defining a default color for the cells and assigning different colors to the other ranges of values that can use Number, Percentage, Percentile and Maximum Value as a basis for defining the color.
For Bar type indicators, options for customizing the values used to define the bars and how these bars are displayed in the column cells are offered.
To define the size of the bars, you can use one of the following options as a basis:
- Fixed value;
- Percentage on measure;
- Measure;
- Percentage on maximum;
- Percentage of sum;
- Percentage on average
To define the way the bar is displayed, you can define the bar style and the color (or colors) to be used, depending on the style chosen.
Four styles of bar are offered:
- Fixed: Defines a fixed color that will be used for the bar;
- Gradient and Ranges: Offer the option of defining which measure will be assigned the colors of the bar (configured through the "Use values" field) and which colors will be used for which value range (Defined through the fields in the "Colors" option);
Automatic: Automatically defines the color and style to be used when creating the bars.
Font Color
Through the font color setting menu, it is possible to modify the way the cell fonts are displayed. You can define the style and color to be used. The available options are:
- Fixed: Sets a fixed color for the font;
- Gradient and Ranges: Defines the color to be used through a parameter chosen by the user;
- Automatic: Automatically sets the color to be used for the font.
Pagination
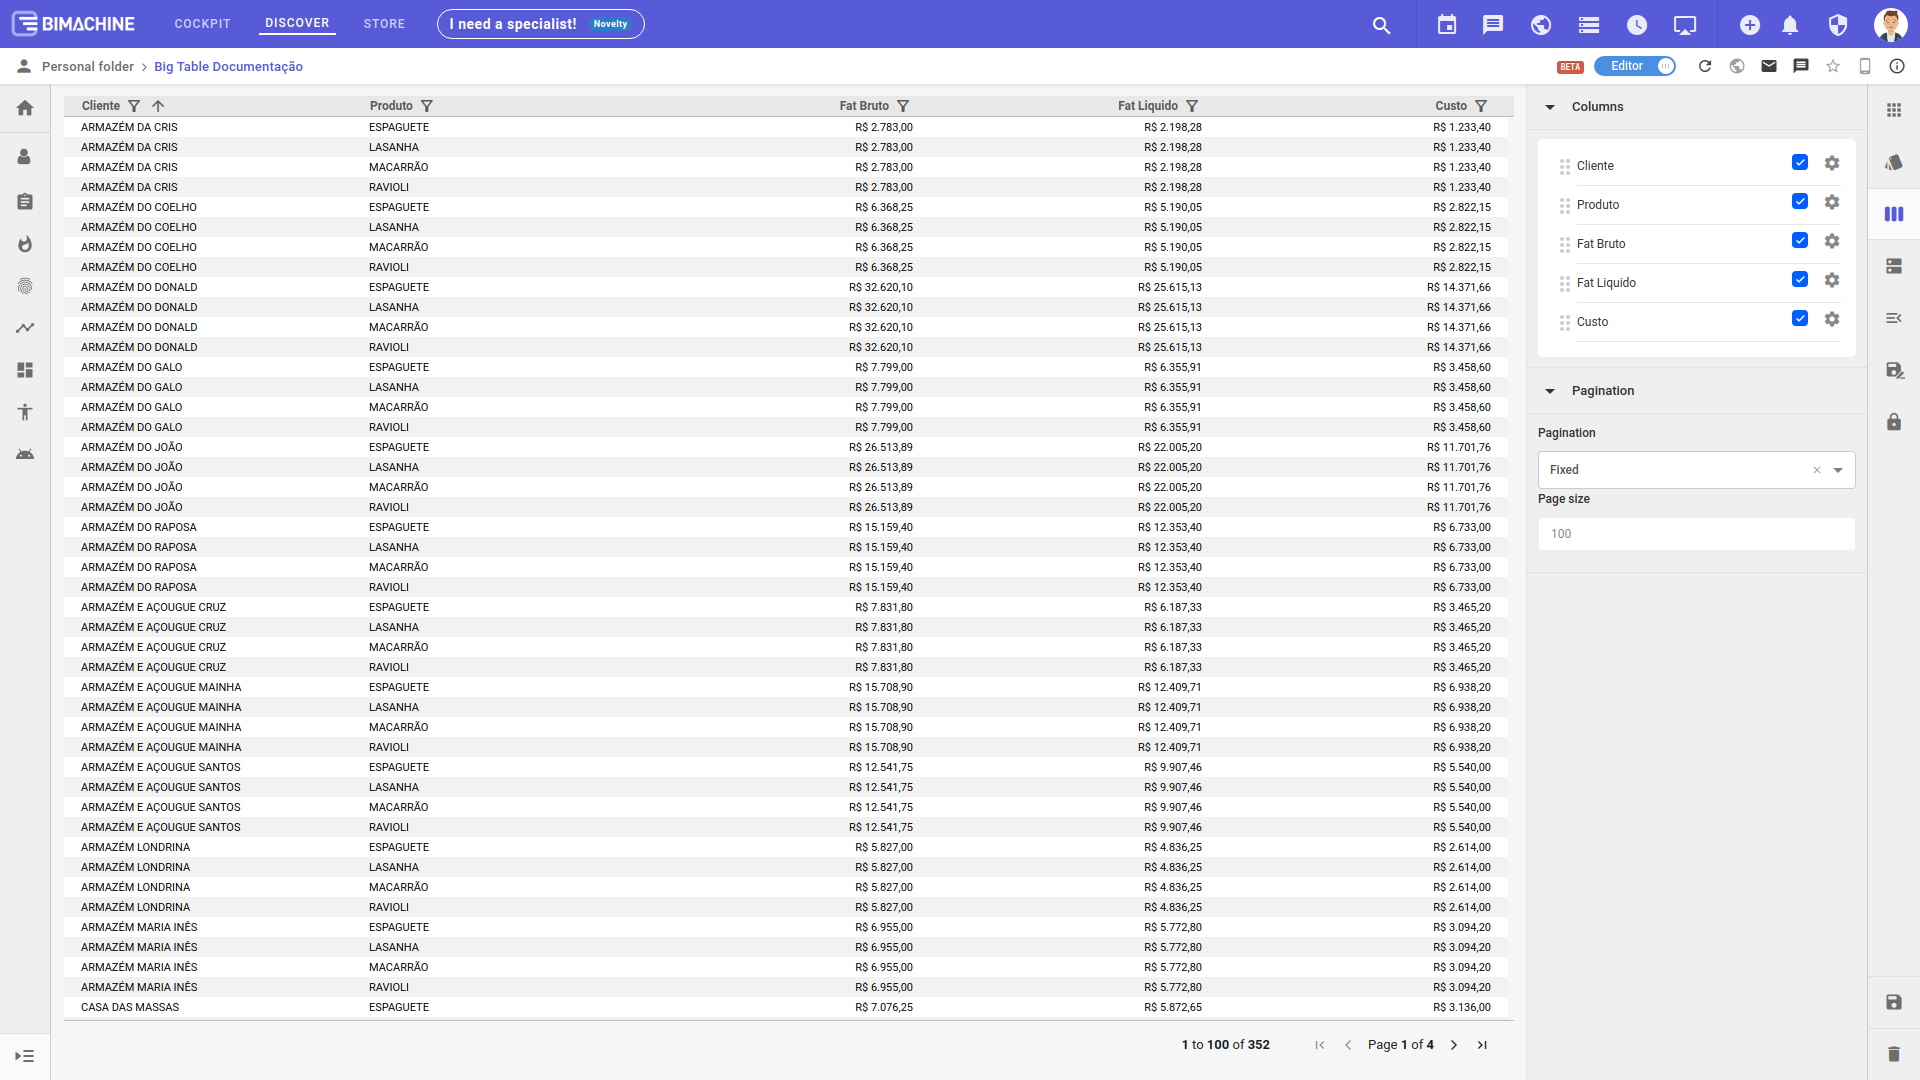
Through the paging menu it is possible to define how the displayed data will be distributed among the Big Table pages. Through this menu it is possible to disable paging, define a fixed number of items per page, or let the number of items be automatically defined based on the number of lines and the amount of space available on each page of the table.

