The term Business Intelligence, or simply BI, was created in the 80’s by the Gartner Group (research and analysis institute for the information technology sector) and is defined as a process of collecting, organizing and analyzing data, formatting reports and management indicators that support decision making in the business environment. In other words, a set of solutions that convert a large amount of data into useful information for strategic decision making.
To start using this tool, it is necessary to have a data source, which can be, for example, through SQL, CSV or API.

After selecting the integration type, you start creating a data structure.
Within this structure we have dimensions, the most used of which are: time (for dates), measure (for numbers), and regular (for text)
Measures
Measures are numerical values that represent the Facts and the performance of a business indicator associated with the dimensions. Ex: Sales value, Sales quantity, Average ticket, etc.
Facts
The Facts contain the measurements/metrics. It has the quantitative character of the descriptive information stored in the Dimensions. It is where business occurrences are stored and it has a "many-to-one" relationship with the peripheral tables (Dimension). It is a table that has only the measures and the ID’s that are linked to the dimensions to show the complete information concerning the data that will be visualized.
Table of fact:

In these example rows of a fact table, the first four columns, Uf, Customer, Product and Salesman, are key columns. The Gross Fat column, contains measure values, which in this example is as "sum", and will sum the total in a hierarchical manner. In a fact table each measure contains a column.
Dimensions
The Dimensions are the descriptors of the data from the Fact. It has the qualitative character of the information and a "one to many" relationship with the Fact table. It is the Dimension that allows the visualization of information through different aspects and perspectives. Ex: Customer registration, payment forms registration, etc.
While the information in the Facts can be repeated many times, the Dimensions register only once. Example: In the previous image we expanded the information from Donald’s Warehouse. He has already bought lasagna several times, but only 1 record of the item will be displayed along with its total value.
Analyses
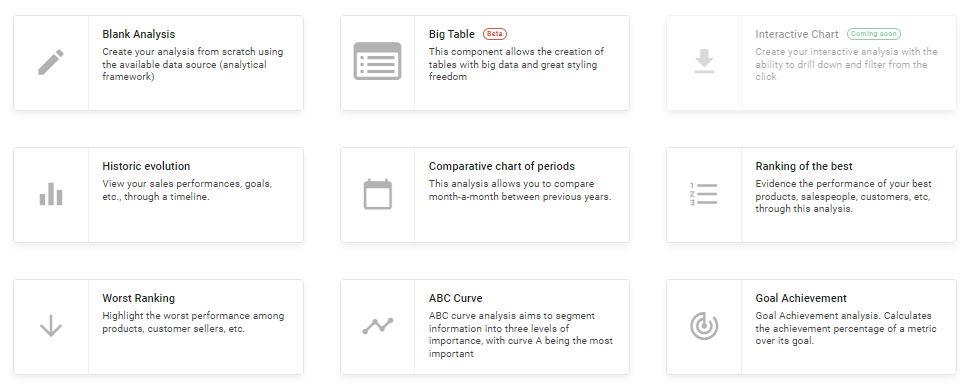
Analytics are tools that serve to generate data analysis. When creating these analyses, you need to determine what issues are necessary to generate satisfactory results.
Here are some examples of types of analyses from BIMachine:

KPI
KPIs, or Key Performance Indicators, are created from metrics. They indicate in percentage or numerical form the result of an action and by which the performance of the organization is evaluated. They are essential in the various departments of a company, because they point out the real results of the investments made, whether in people management, process optimization, cost reduction, increased employee productivity, and several others. Within a strategic planning, the KPIs aim to provide information to the tactical level of an organization.
See some KPI models:

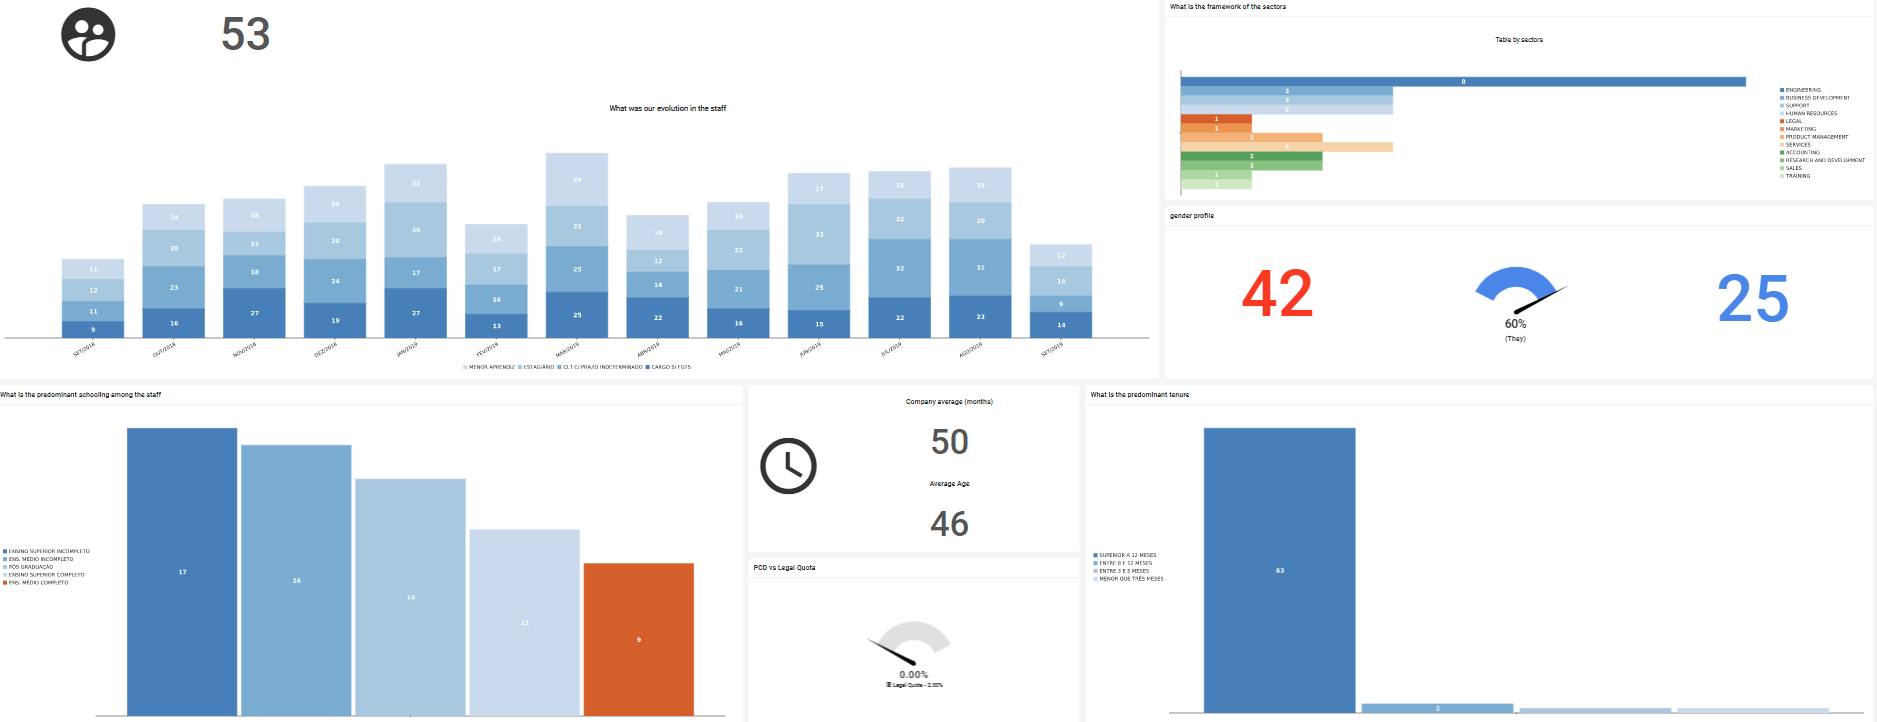
Dashboard
After creating the analyses and KPIs, Dashboards are created. Thus, it is possible to visualize in a centralized manner the information in a clearer, faster, and more secure way in a quickly updated time. With this, management has an extra help to make decisions, since employees can act based on data.


