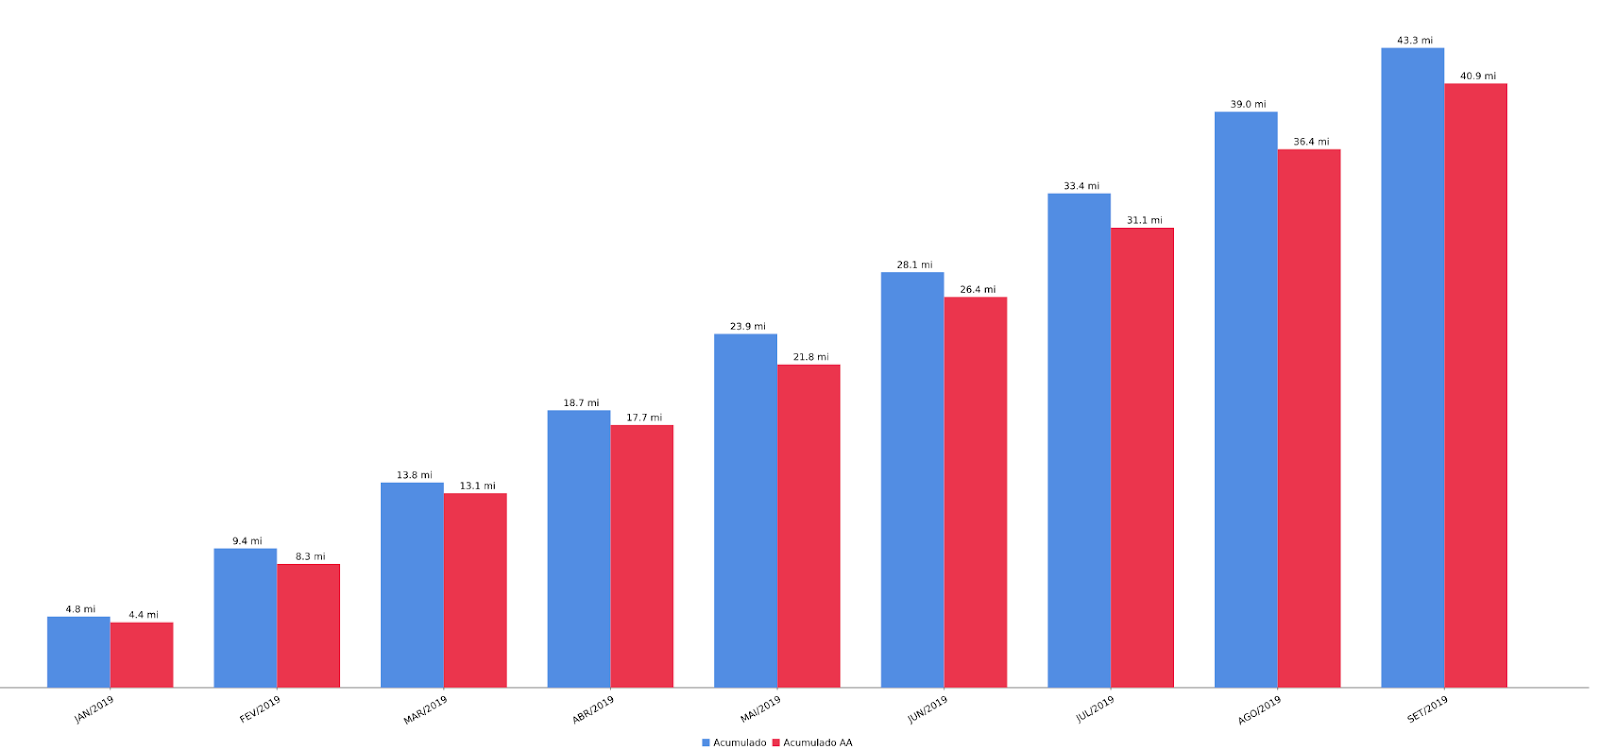
Visualize the running total of the metrics chosen in a period of time. For instance, one could analyze the sum of the daily sales of a month and compare to the same period in the last year.
The running total will be calculated based on the level chosen, so one could calculate running total of months, quarters and years. Helps while analyzing time series with innate seasonality.
Business example:
MONTHLY time series of the CURRENT YEAR getting the running total of the REVENUE of the YEAR, compared to the previous YEAR based on the date dimension of DATE OF THE INVOICE.
Parameters:
<Measures>: Name of the metric to be analyzed
<DateDimension>: Name of the date dimension
<Level>: Level in which the running total will be calculated
<ComparisonLevel*>:Level to be compared to the previous year
<LevelShown**>: Date level that will be portrayed in the chart
<BIMFDateDimension>:Date dimension to be utilized by the filter
<DynamicDate>:Date to be filtered
*Year, Semester, quarter, month or week
** Has to be below the level used in the <ComparisonLevel>. For instance, if one wants to calculate the running total of a year, the shown levels have to be below year.
Resulting chart:


