
Add and edit KPIs and assisted analyses on dashboards
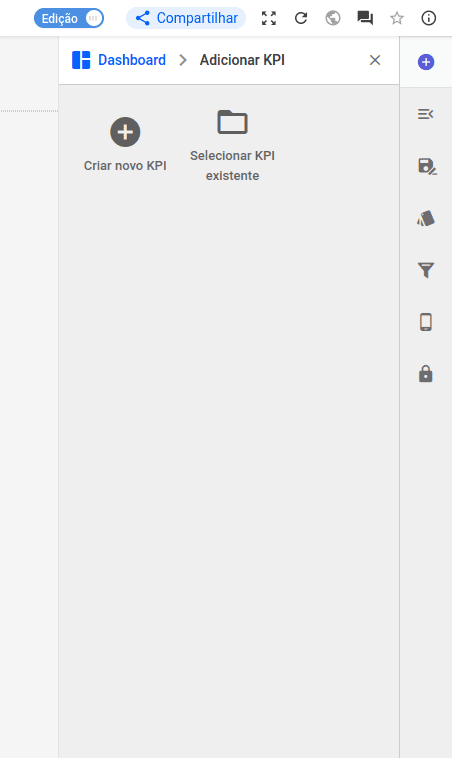

It is now possible to create a new KPI or assisted analysis via the dahsboard screen.
Zero point marker

The new zero point marker option draws an axis at the zero point of the graph, making it easier to see negative values
Waterfall chart
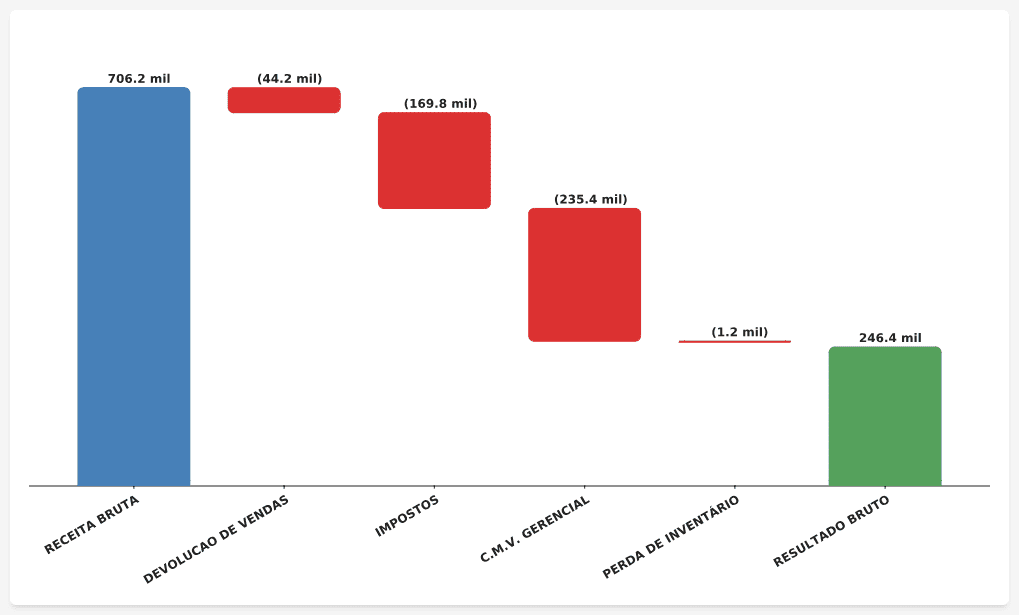
The waterfall chart is another alternative for visualizing graphs. A waterfall graph is a visual representation that shows how an initial value changes over time due to different factors, indicating increases and decreases by means of horizontal bars. It is widely used in finance and accounting to highlight the evolution of financial resources over a period of time.
See other corrections made in this version below:
| Number | Task | Version |
|---|---|---|
| #7798 | Correction made to KPI colors | 2.76.0 |
| #7618 | New warning screen when deleting an object on a dashboard | 2.76.0 |
| #6569 | Review of jobs in the field of activity located in the profile | 2.76.0 |