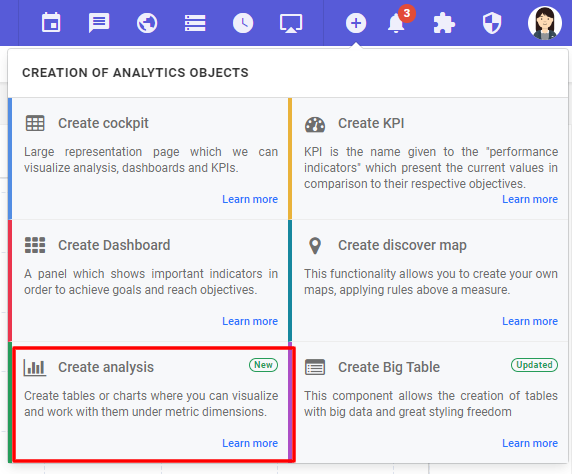
In Discover mode, click on the “Create analytical objects” icon and then on “Create analysis”.

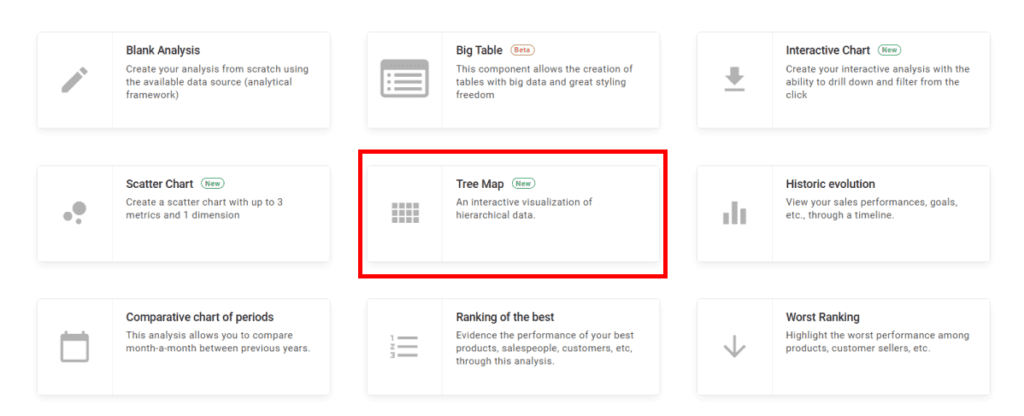
Select “Treemap”.

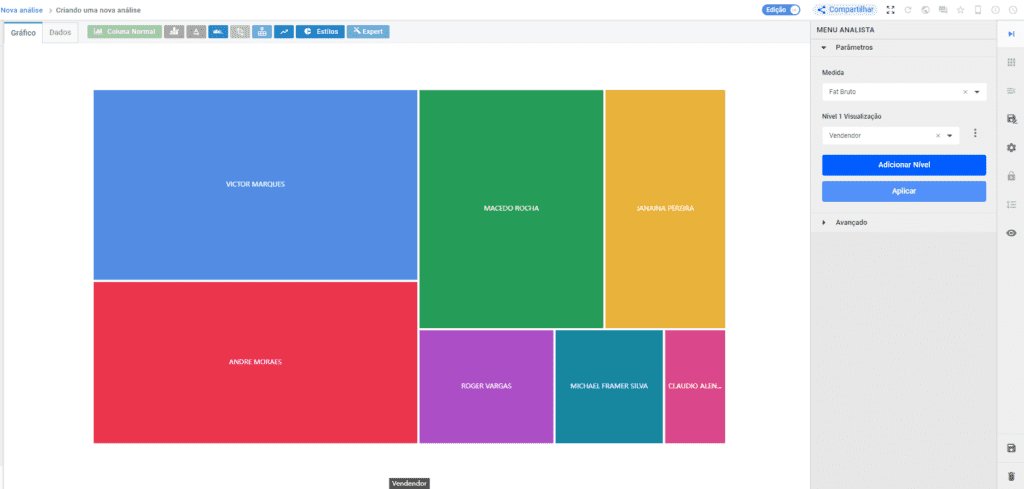
Next, select the data structure and fields to create the chart. Once everything is filled in, click “Apply” and save.

For more information about treemap, click here .

