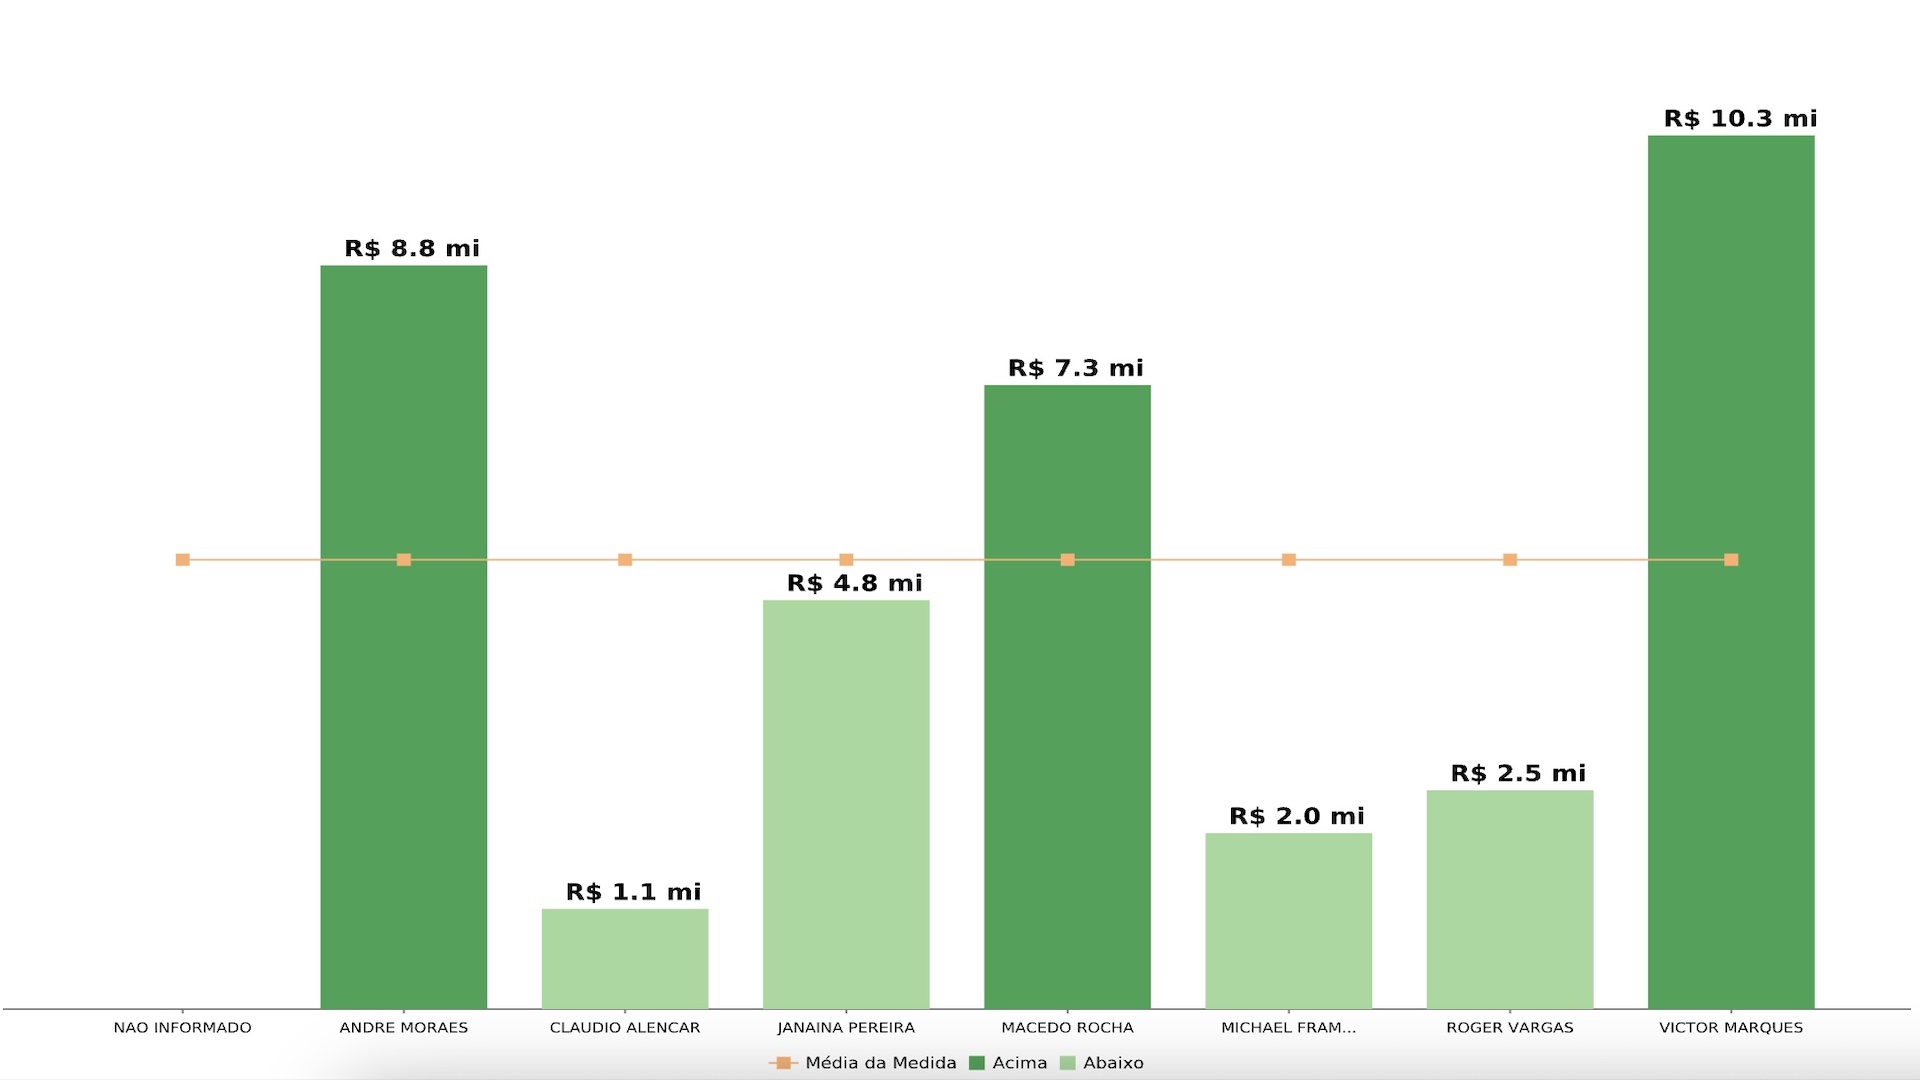
Clearly analyze which information is above or below the chosen comparative, quickly visualizing the items that need more attention.
This analysis allows you to quickly visualize which information is above or below the chosen comparative.
Application example:
Which PRODUCTS are ABOVE or BELOW the SALES AVERAGE.
Resulting chart:


