In this topic we will show the functionalities that exist when creating/editing a KPI when we reach the last part, layout configuration.
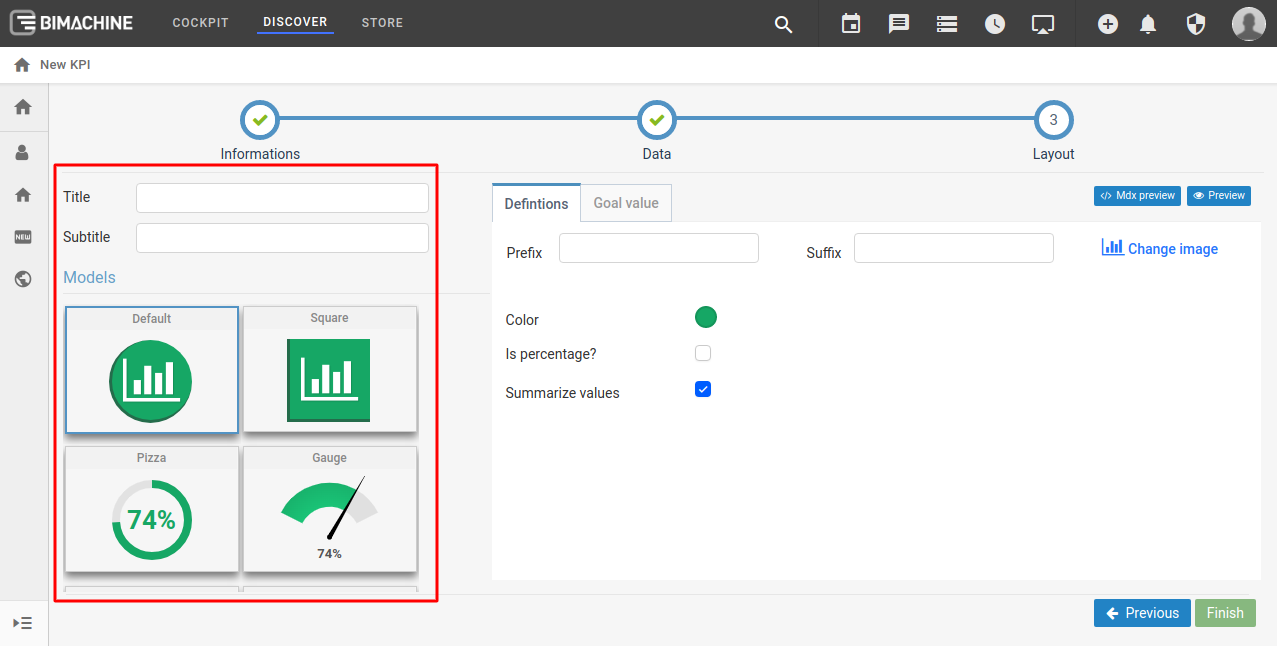
The structure (highlighted above), defines the following:
- Title: above the value, a title that defines the KPI.
- Subtitle: below the value, a caption for the KPI.
- Models: lists the existing templates for creating the KPI.
Definitions:
- Prefix: enter a prefix to accompany the value (ex: R$ 40.40).
- Suffix: enter a suffix to accompany the value (ex: 40 ºC).
- Percentage: select if it is a percentage instead of a value (already marked if the selected measure is a percentage).
- Summarize values: if it is not a percentage, it will summarize long values (ex: instead of showing "1000000"; it will show "1mi").
- Decimal Places: if it is percentage, you define how many digits you want to have after the decimal.
- Color: defines the color of the KPI (if you use ranges in the "Goal value" tab, this will not be applied).
Goal value
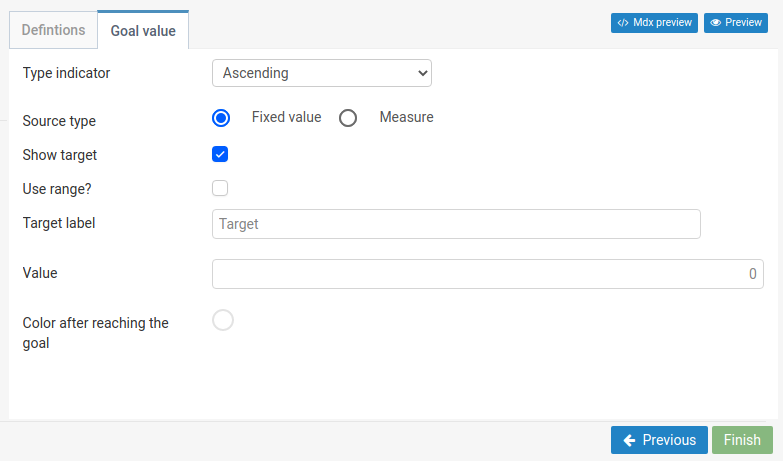
In the goal value tab, we define the following:
- Indicator type: ascending or descending.
– Ascending: when the KPI will calculate the growth from the target.
– Descending: when the KPI will calculate the growth inversely from the target.
- Source type: fixed value or measure.
– Fixed value: define a goal value
– Measure: define another measure as a goal
Use range: make the KPI change color according to the value it reaches (e.g. blue 10%, yellow 30%, red above 50%).
Target label: goal description label.
Value: if you chose source type "Fixed value", enter the value of the goal you want to set.
Color after reaching the goal: define the color for the KPI once it reacher the goal value, without needing to used a range.
Ranges
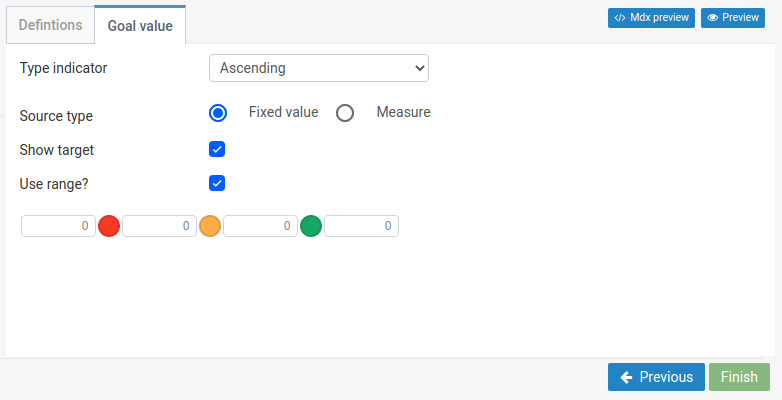
If you chose to use ranges, you will be presented with 4 color fields to relate with a growth goal.
1st to 2nd field: the KPI will turn red (according to the image above).
2nd to 3rd field: the KPI will turn yellow (according to the image above).
3rd to 4th field: the KPI will turn green (according to the image above).
Remember: you can change the color of each field.

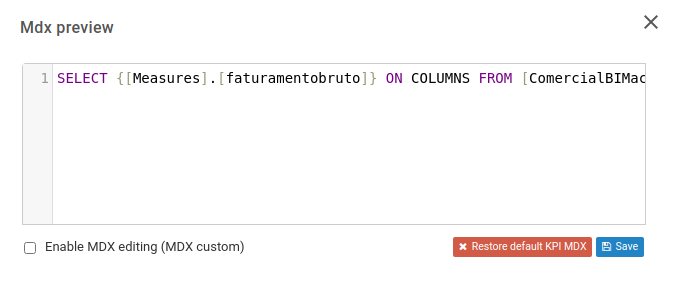
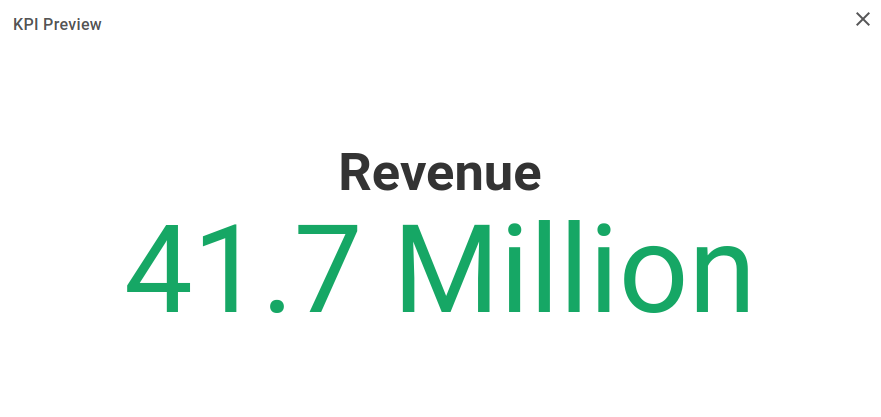
You can preview the KPI before saving, by clicking on "Preview", and you can preview the MDX used in the KPI, by clicking on "Mdx preview", and change it.
Preview
MDX Preview
